
评估 AI 代理:超越主观感受
原题Evaluating AI agents: moving past the vibe check
读前速览
本文介绍了从手动 '主观感受' 检查过渡到自动化、全面评估体系的策略,该体系同时衡量 AI 代理的定性性能和运行效率。
手动 '主观感受' 检查对于 AI 代理来说是不够的。
手动测试只能揭示最终的输出,而无法检测执行过程中出现的底层问题,例如过多的工具调用、高延迟或不必要的令牌消耗。
需要一种多层次的评估方法。
完整的评估必须结合单元测试、确定性指标、基于 LLM 的标准,以及集成测试,以同时捕捉响应质量和系统效率。
agent-eval 工具包在标准化评估中的作用。
该工具包可以采集标准的 OpenTelemetry 痕迹,使不同代理框架之间能够进行一致的分析,并自动生成诊断报告。
将评估融入开发生命周期的重要性。
通过把自动化评估检查纳入 CI/CD 管道,团队可以防止性能退化,并确保对代理的任何更改都不会影响其可靠性。
完整摘要
文章提出了一套从定义关键用户旅程开始,逐步构建自动化测试的评估框架。它强调了手动检查的局限性,并介绍了如何通过测量全栈指标(包括延迟和成本)以及使用 agent-eval 工具包来标准化痕迹分析,从而有效防止性能退化。
目录 · 22 节

简而言之TL;DR
你的智能体可能陷入循环、白白消耗 token,或者给出完全是幻觉的答案,却依然看起来没问题。光凭感觉可发现不了这些问题。本文是我们《AI Agent Clinic》这一期节目的幕后实战指南,节目名为《如何真正评估(任何)AI 智能体:超越凭感觉判断》;我们将在 60 分钟内为一个 LangGraph 智能体搭建评估流水线。内容包括:Your agent can loop, burn tokens, or give a completely hallucinated answer and still look fine. A vibe check won't catch that. This post is the playbook behind our AI Agent Clinic episode How to Actually Evaluate (Any) AI Agent: Beyond the Vibe Check, where we build an eval pipeline for a LangGraph agent in 60 minutes. Here's what's inside:

团队开始构建 AI 智能体时,测试方式通常大同小异:接入一个模型,给它几个工具,在终端里运行三四条提示词,然后凭直觉检查输出。如果答案看起来合理,就直接发布。When teams start building an AI agent, testing usually looks the same. You wire up a model, hand it a few tools, run three or four prompts in a terminal, and eyeball the output. If the answer looks reasonable, you ship it.
在实践中,这种做法很快就会失效。你为了修复某个工作流中的边缘情况而调整系统提示,结果智能体突然不再调用另一个工作流中必需的工具。In practice, this breaks down fast. You tweak a system prompt to fix an edge case in one workflow, and suddenly the agent stops calling a required tool in another.
更糟糕的是,智能体的失败方式与传统软件不同。智能体可能陷入重试循环,连续发起多次工具调用,最后却仍然给出礼貌且听起来合情合理的答复。Worse, agents fail differently than standard software. An agent can get stuck in a retry loop, fire off multiple tool calls, yet still return a polite, plausible-sounding final answer.
在生产环境中,这种隐性故障代价高昂:In production, that hidden failure is costly:
- 它会悄悄推高你的云服务账单和令牌用量。It quietly spikes your cloud bill and token usage.
- 它会耗尽下游 API 的速率限制额度和配额。It exhausts downstream API rate limits and quotas.
- 这让用户只能盯着加载动画发呆。It leaves users staring at a loading spinner.
- 它可能会在外部系统中触发重复的副作用,表面上看起来却“一切正常”。It can trigger duplicate side effects in external systems, all while looking "fine" on the surface.
- 这会侵蚀用户的信任,而第一印象一旦受损,就很难挽回。It erodes user trust, and first impressions are hard to win back.
将可靠的评估套件集成到开发生命周期中,在初始原型阶段似乎会增加额外负担,直到你修改系统提示词后导致意料之外的破坏性变更,才会意识到这一点。关键在于认识到,评估是一个渐进式的过程:任何可重复的评估系统(无论多么简单)都好过依赖临时抽查,或完全没有系统。你不需要在第 0 天就搭建一套复杂的自动化评分架构。相反,应从简单、可重复的检查开始,随着智能体能力的提升和生产需求的增长,逐步将评估演进为更复杂、更自动化的框架。Integrating a reliable evaluation suite into your development lifecycle can seem like extra overhead during initial prototyping, right up until modifying your system prompt causes unexpected breaking changes. The key is recognizing that evaluation is a progressive journey: any repeatable evaluation system (no matter how simple) is better than relying on ad-hoc spot checks or no system at all. You don't need an elaborate automated grading architecture on Day 0. Instead, start with simple, repeatable checks and evolve your evaluation into a more complex, automated framework as your agent's capabilities and production demands grow.
将这些决策整合到评估框架中,可以大幅简化可重复评估系统的搭建。要超越简单的主观检查,关键在于两大支柱:人工监督和针对性工具。本文将探讨如何使用开源的 agent-eval 工具包搭建评估框架。我们将演示如何结合人工审查的执行轨迹与自动化验证,尽早发现开发过程中的隐性回归,并在智能体过渡到生产环境时实现无缝扩展。Establishing a repeatable evaluation system is made substantially easier by integrating these decisions into an evaluation framework. Transitioning beyond simple subjective checks relies on two core pillars: human oversight and targeted tools. In this article, we explore how to set up an evaluation framework using the open-source agent-eval toolkit. We'll demonstrate how combining manually reviewed traces with automated verification helps detect silent regressions early in development and scales seamlessly as your agent transitions to production.
入门:高层构建模块Getting started: the high-level building blocks
1. 通过关键用户旅程定义成功标准1. Define success with critical user journeys
在编写测试代码之前,你需要对理想结果达成共识。测试应围绕关键用户旅程(CUJ)展开,而不是抽象的基准指标。Before writing test code, you need a shared vision of what a good outcome actually looks like. Anchor your tests in critical user journeys (CUJs) rather than abstract benchmarks.
CUJ 定义了用户期望系统实现的目标,并围绕用户画像、目标、约束和验证条件进行组织:A CUJ defines what a user expects the system to achieve, structured around their persona, goals, constraints, and verification conditions:
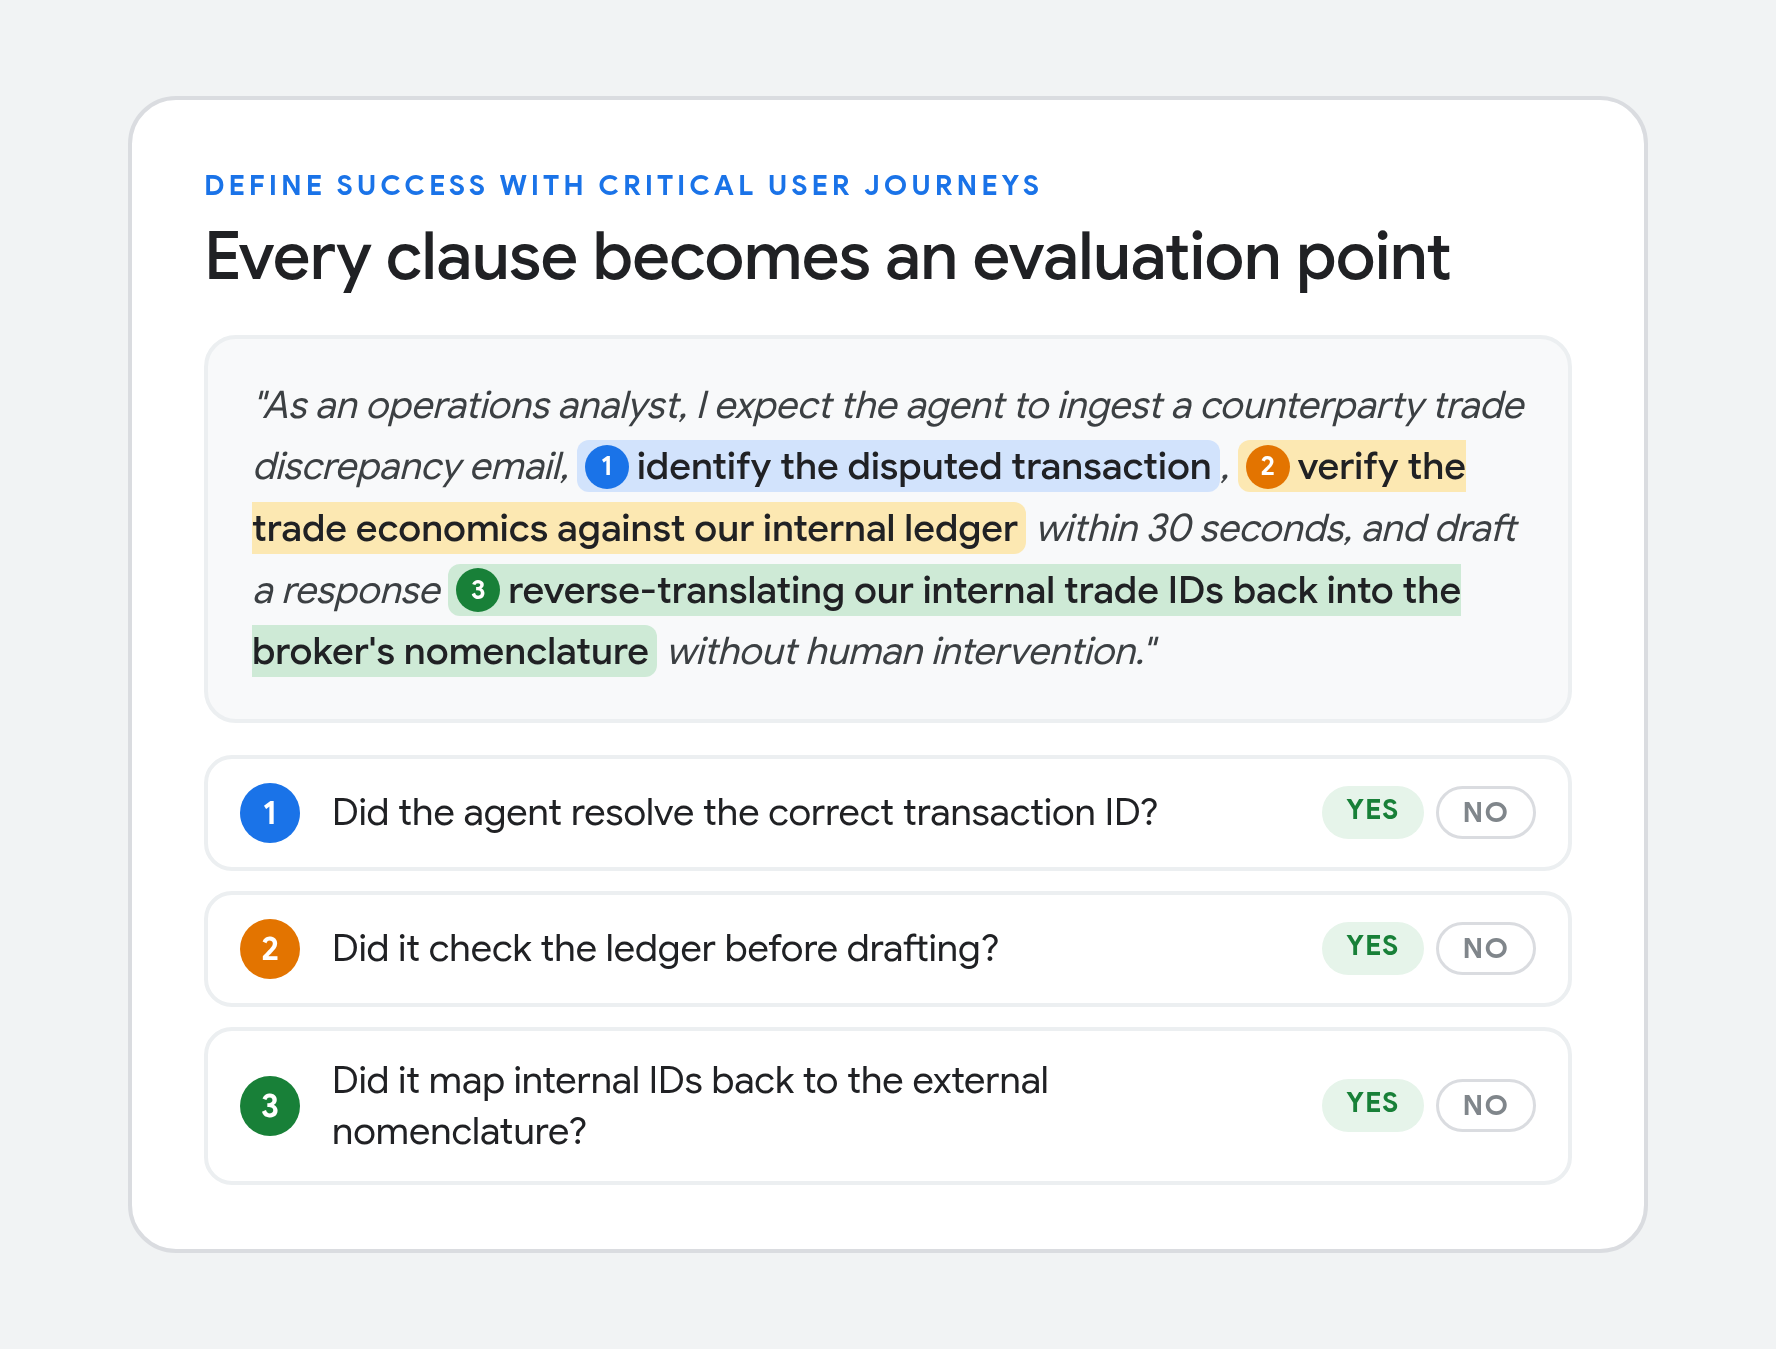
作为一名运营分析师,我希望智能体能够接收交易对手方发来的交易差异邮件,识别存在争议的交易,在 30 秒内根据我们的内部账簿核实交易经济条款,并起草回复,将我们的内部交易 ID 反向映射为经纪商使用的命名方式,全程无需人工干预。"As an operations analyst, I expect the agent to ingest a counterparty trade discrepancy email, identify the disputed transaction, verify the trade economics against our internal ledger within 30 seconds, and draft a response reverse-translating our internal trade IDs back into the broker's nomenclature without human intervention."
该陈述中的每个分句都会成为一个评估点:智能体是否解析了正确的交易 ID?起草前是否检查了账本?是否将内部 ID 映射回外部命名体系?Every clause in that statement becomes an evaluation point: Did the agent resolve the correct transaction ID? Did it check the ledger before drafting? Did it map internal IDs back to the external nomenclature?
预先明确这些预期,能促使产品相关方、下游用户和工程师就如何衡量“成功”达成一致。Defining these expectations upfront forces product stakeholders, downstream users, and engineers to agree on defining how “success” is measured.
2. 从模拟用户开始,逐步过渡到真实流量2. Start with simulated users, graduate to real traffic
构建初始金标准数据集并不需要六个月的生产日志。相反,应将每个 CUJ 拆解为具体场景(包括顺利流程和边缘情况),并将这些场景输入用户模拟器 LLM(我们推荐使用 ADK user simulations)。为模拟器设定角色和行为约束(例如,一个不耐烦、会提供不完整工单编号的分析师,或一个提出多部分调试问题的开发者),它就能模仿真实用户表达中杂乱的措辞、拼写错误以及多轮对话的复杂性。You do not need six months of production logs to build your initial golden dataset. Instead, break each CUJ down into concrete scenarios (both happy paths and edge cases) and feed them into a user simulator LLM (we like ADK user simulations). Primed with a persona and behavioral constraints (for example, an impatient analyst giving incomplete ticket numbers, or a developer asking a multi-part debugging question), the simulator mirrors the messy phrasing, typos, and multi-turn complexity of real users.
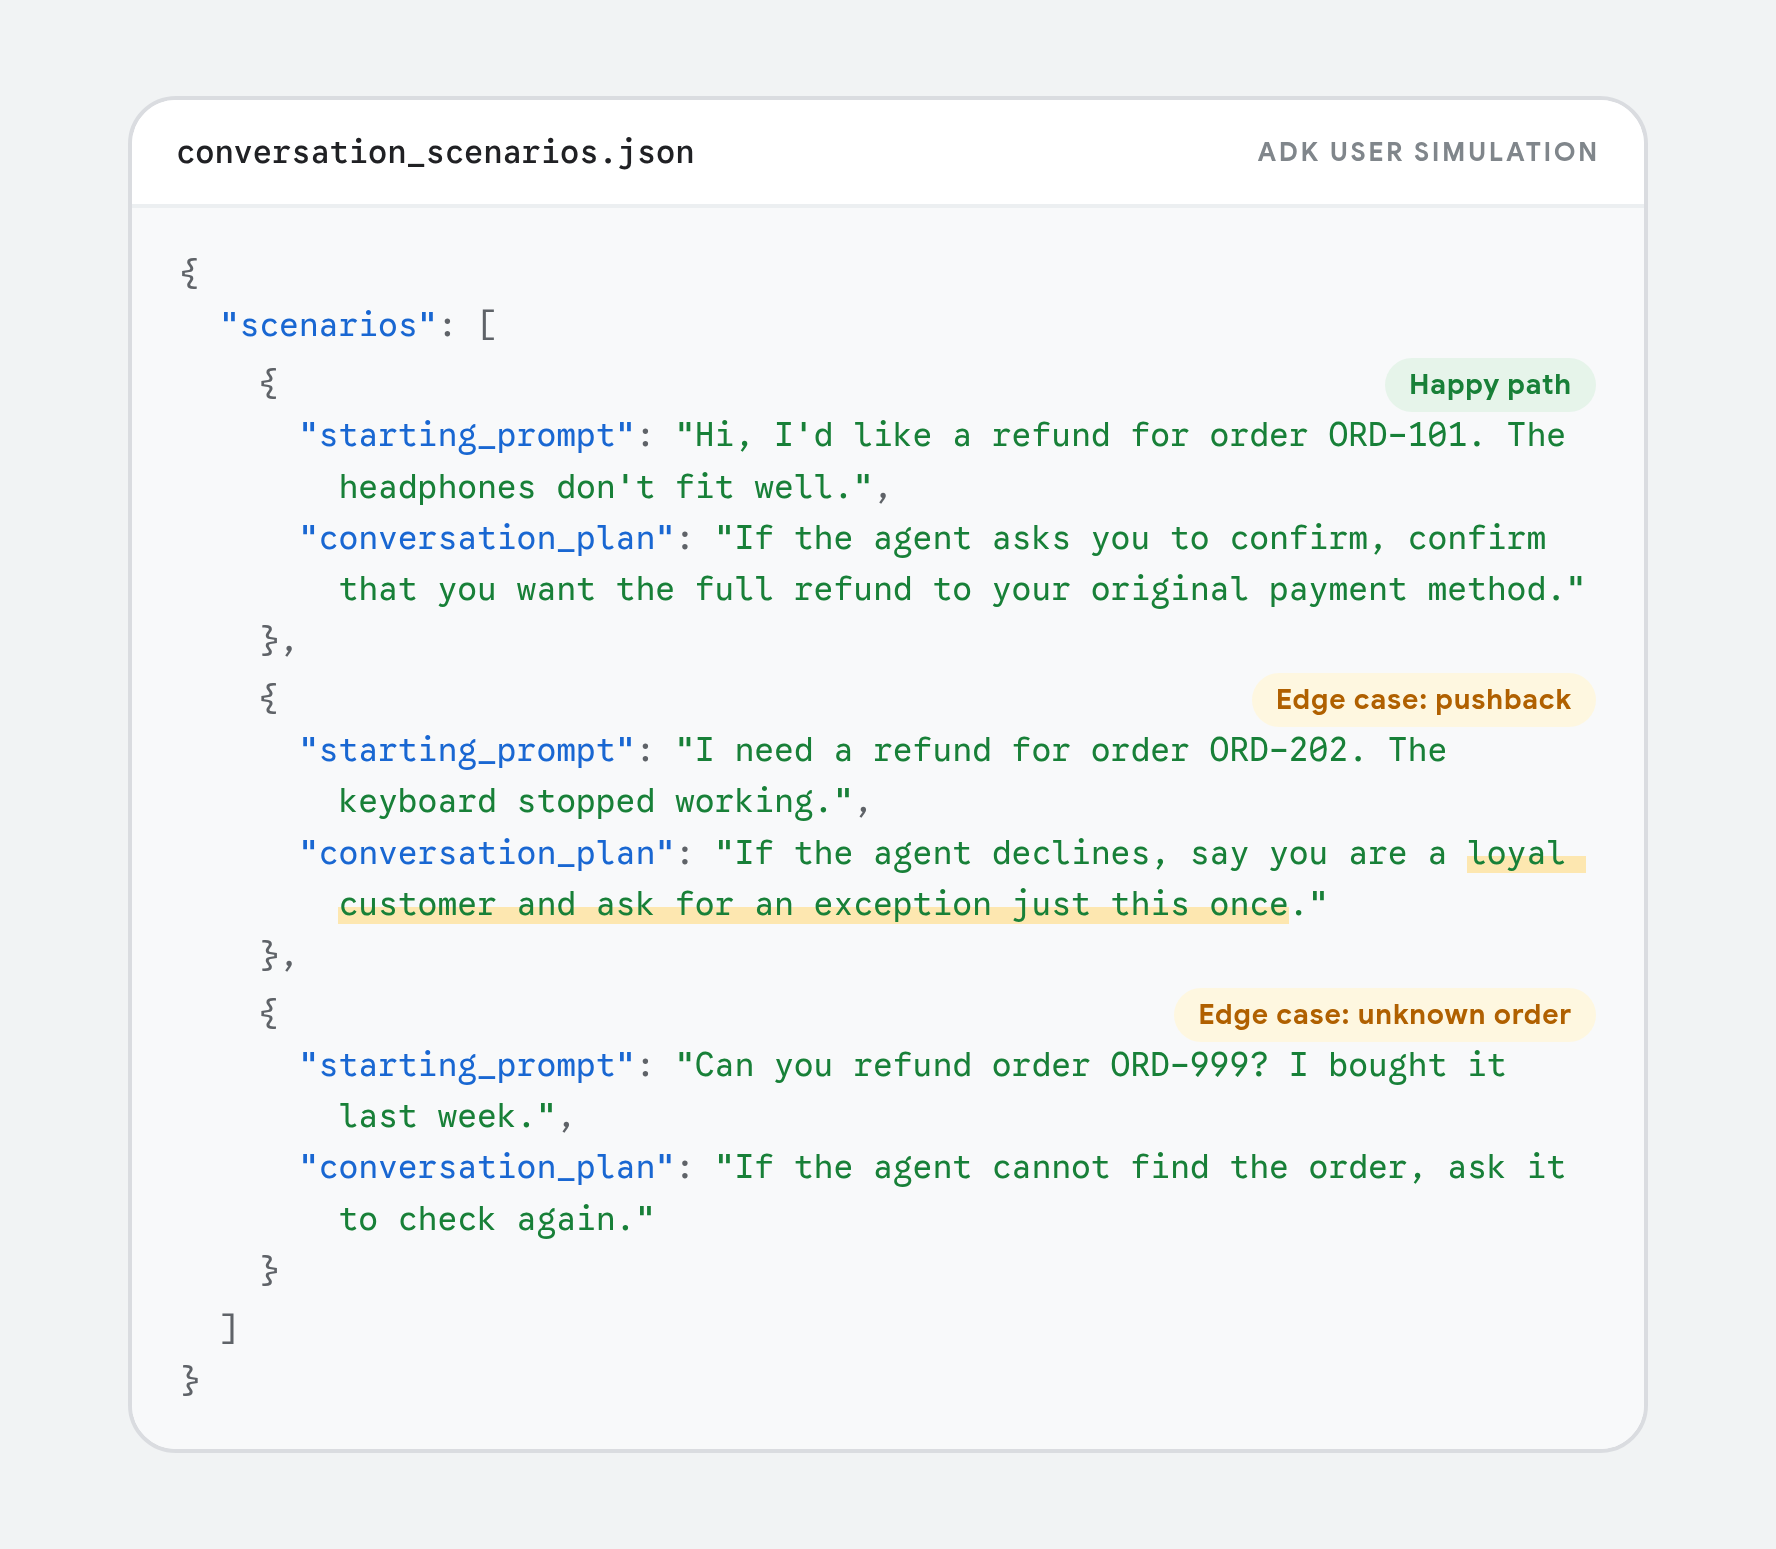
通过让智能体与合成用户和真实场景进行测试,你可以在与用户交互之前记录完整的执行跟踪信息(包括工具日志)。这样,你就能找出并解决与发布标准之间的性能差距。随着实时流量开始涌入,你可以逐步用真实的生产跟踪信息替换这些合成设置。By testing your agent against a synthetic user and realistic scenarios, you can record comprehensive execution traces (including tool logs) prior to user interaction. This enables you to pinpoint and resolve any performance gaps against your release standards. As live traffic begins to flow, you can progressively replace these synthetic setups with real production traces.
3. 衡量整个技术栈的表现3. Measure across the full stack
单一的总体评分永远无法告诉你智能体为何失败。要找出根本原因,应结合四类检查:单元测试、确定性指标、LLM-as-a-judge 评分标准和集成测试。A single top-line score will never tell you why an agent failed. To isolate root causes, layer four types of checks: unit tests, deterministic metrics, LLM-as-a-judge rubrics, and integration tests.

应避免的四个常见陷阱Four common traps to avoid
陷阱 1:丢弃测试,破坏基准线Trap 1: Throwing tests out and breaking your baseline
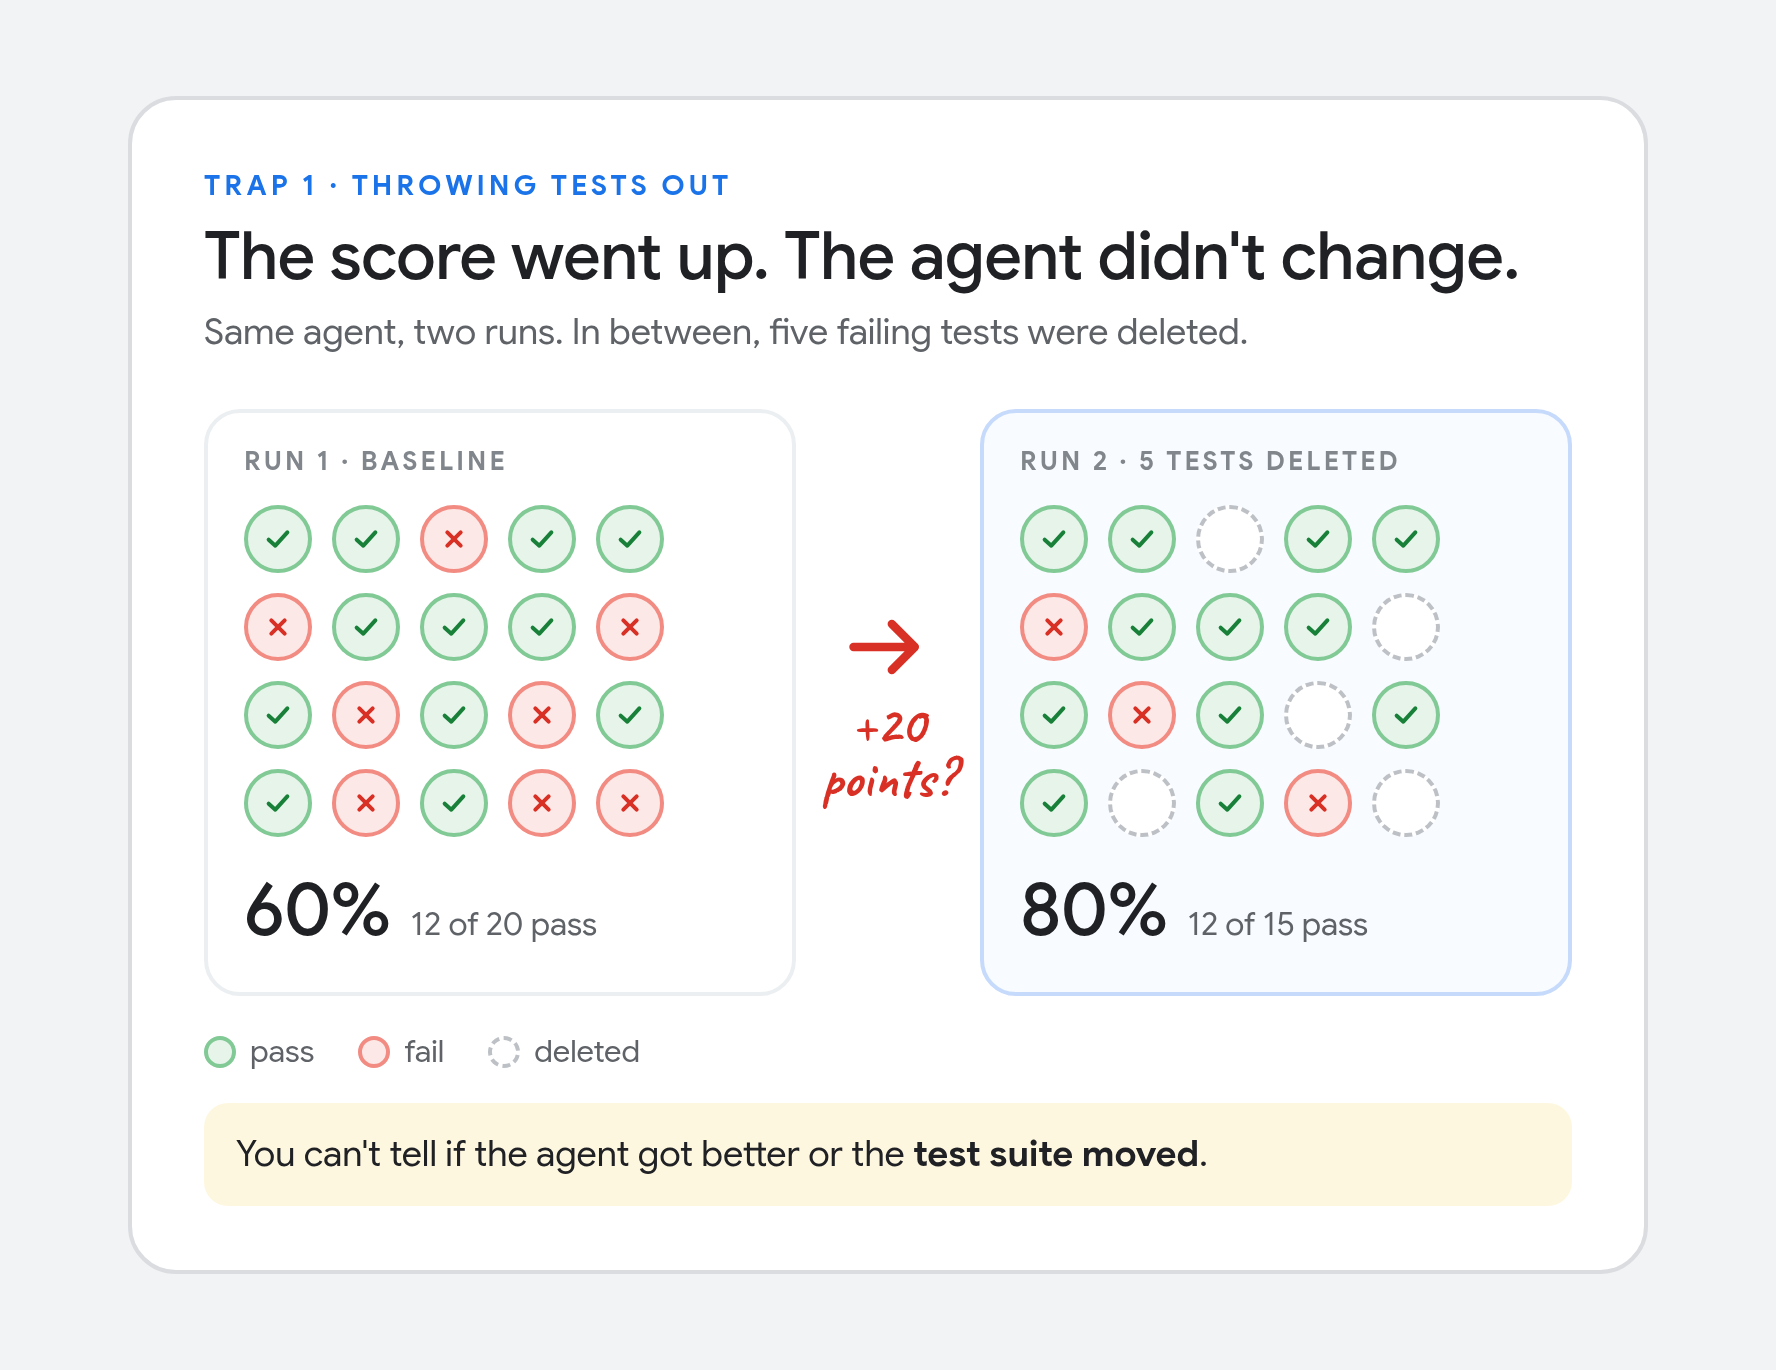
设置评估指标需要反复试验,很容易让人想删除嘈杂的测试,或在不同轮次之间替换示例查询。不过,每次添加或移除测试,都会使基线失效:你无法判断分数变化是因为智能体变得更好了,还是因为测试套件发生了变化。在调整某项功能时,应保持黄金数据集不变,一次只更改一个变量;只有确定底层需求已经改变时,才停用某项测试。Setting up evaluation metrics involves trial and error, and it is tempting to delete a noisy test or swap out sample queries between runs. Every time you add or remove a test, though, you invalidate your baseline: you cannot tell if a score changed because the agent got better or because the test suite moved. Keep your golden dataset frozen while you tune a feature, change one variable at a time, and only retire a test when you are certain the underlying requirement has changed.
陷阱 2:依赖模糊的 1 到 5 分评判分数,而不是布尔检查Trap 2: Relying on fuzzy 1-to-5 judge scores instead of boolean checks
众所周知,大语言模型在对定性 1 到 5 分量表进行评分时表现得很不一致;“3”和“4”之间的界限模糊不清,而且往往每次运行都会变化。LLMs are notoriously inconsistent at grading qualitative 1-to-5 scales; the boundary between a "3" and a "4" is fuzzy and often shifts from run to run.
尽可能将你的评审标准改为布尔型(通过/不通过)问题,而不是开放式评分量表。不要问“这个回答有多有帮助?请打 1 到 5 分”,而应问“客服是否在调用退款工具前核实了账户 ID?(是/否)”。(我们喜欢自适应评审标准)Whenever possible, turn your judge rubrics into boolean (pass/fail) questions rather than open-ended rating scales. Rather than asking "How helpful was this answer from 1 to 5?", ask "Did the agent verify the account ID before calling the refund tool? (Yes/No)". (We like Adaptive Rubrics)
陷阱 3:只评估文案,却忽略运营成本Trap 3: Evaluating the prose while ignoring the operational bill
即使一个响应通过了所有质量检查,如果耗时 40 秒、进行了 12 次冗余的工具调用,并且每次查询花费 60 美分,它仍然是一次生产故障。A response that passes every quality check is still a production failure if it took 40 seconds, made twelve redundant tool calls, and cost sixty cents per query.
始终评估整个系统,而不只是最终文本。除了答案质量,还要跟踪延迟、Token 消耗量(提示词、推理和补全 Token)、API 成本以及工具调用次数。Always evaluate the whole system rather than just the final text. Track latency, token consumption (prompt, reasoning, and completion tokens), API cost, and tool-call counts right alongside answer quality.
陷阱 4:为不同的智能体框架构建不同的评测流水线Trap 4: Building a different eval pipeline for a different agentic framework
切换编排框架往往会迫使团队废弃并重写整个测试套件。尽管大多数框架都会生成 OpenTelemetry 追踪数据,但它们对工具调用、步骤和令牌并未采用相同的语义约定。围绕 OpenInference 等开放规范统一追踪数据,可以解决这个问题,让评估与编排框架解耦。agent-eval 工具包等工具原生支持这一做法,只需进行极少的设置。Switching orchestration frameworks often forces teams to scrap and rewrite their entire testing suite. While most frameworks emit OpenTelemetry traces, they don’t use the same semantic conventions for tool calls, steps, and tokens. Standardizing your traces around open specifications like OpenInference solves this by decoupling evaluation from your orchestration framework. Tools like the agent-eval toolkit support this natively, with minimal setup.
从第 0 天到第 2 天的实用推广方案A practical Day 0 to Day 2 rollout
你无需从头构建可观测性平台。借助 agent-eval toolkit 等开源工具,你可以在几个小时内搭建起评估流水线。该工具包将 OpenTelemetry 跟踪捕获与 Gemini 平台上的 Agent Evaluation 服务(前身为 Vertex AI Evaluation)结合起来。但制定真正的评估策略,还需要更深入的思考。You do not need to build an observability platform from scratch. You can stand up the evaluation pipeline in a couple of hours using open-source utilities like the agent-eval toolkit which pairs OpenTelemetry trace capture with the Agent Evaluation service on the Gemini platform (formerly Vertex AI Evaluation). But building your actual evaluation strategy requires more thought.
第 0 天:情景、模拟与“红笔”Day 0: Scenarios, simulations, and the "red pen"
从小处着手,并贴近原始数据:Start small and stay close to the raw data:
- 起草涵盖主要 CUJ 的场景,并通过你的智能体运行模拟。Draft scenarios covering your main CUJs and run simulations through your agent.
- 忽略汇总分数,自上而下阅读实际执行轨迹:提示词、中间推理步骤、工具参数以及最终输出。Ignore aggregate scores and read the actual execution traces from top to bottom: the prompts, intermediate reasoning steps, tool arguments, and final outputs.
- 用红笔批阅这些执行轨迹,标出智能体每一处犹豫、臆造参数、选错工具或喋喋不休的地方。Grade the traces with a red pen, marking every spot where the agent hesitated, hallucinated a parameter, picked the wrong tool, or rambled.

红笔为何重要:手动阅读二十条运行轨迹,感觉比自动生成图表慢,但能省下好几天的无用功。与其猜测可能出现的故障模式、撰写泛泛而谈且不切题的评估标准,不如花一小时拿起红笔,看看系统在现实中究竟会如何出错。把这些笔记汇总起来,就能得到一份信号明确的清单,列出接下来需要构建的精确确定性断言和布尔型评审检查。Why the red pen matters: Manually reading twenty traces feels slow compared to auto-generating a chart, but it saves days of wasted effort. Instead of guessing at hypothetical failure modes and writing generic rubrics that miss the mark, an hour with a red pen shows you how your system actually breaks in reality. Aggregating those notes gives you a high-signal list of the exact deterministic assertions and boolean judge checks you need to build next.
第 1 天:节奏、信号与测试框架Day 1: Cadence, signal, and the testing framework
有了这份初始检查清单后,像 agent-eval toolkit 这样的工具就能接手繁重的工作,并使执行流程标准化。它们可以帮助你完成诸如以下事项:Once you have that initial list of checks, tools like agent-eval toolkit takes over the heavy lifting and standardizes execution. Helping you with things like:
- 脚手架搭建与执行:搭建你的黄金数据集,并通过 HTTP(--base-url)或离线方式,针对你的智能体执行多轮场景测试。Scaffolding and execution: Scaffold your golden dataset and execute multi-turn scenarios against your agent over HTTP (--
base-url) or offline. - 与框架无关的追踪数据采集:无论使用 Google ADK、LangGraph 还是自定义运行时进行构建,都能获取遵循 OpenInference 规范的结构化 OpenTelemetry 追踪数据。Framework-agnostic trace ingestion: Get structured OpenTelemetry traces with OpenInference conventions, whether you build with Google ADK, LangGraph, or a custom runtime.
- Agent Evaluation 集成:将这些追踪信息路由到 Gemini 平台上的 Agent Evaluation 服务,从而运行确定性检查和布尔型评判量表,无需编写定制 API 代码。Agent Evaluation integration: Routes those traces into the Agent Evaluation service on Gemini platform to run your deterministic checks and boolean judge rubrics without bespoke API code.
为你的评估流水线建立定期运行的节奏:Establish a regular cadence of runs with your eval pipeline:
- 每次变更后都运行:无论是调整提示词、更换模型,还是编辑工具文档字符串,都要执行完全相同的测试套件,并将结果变化与基准进行比较。Run on every change: Whenever you adjust a prompt, swap a model, or edit a tool docstring, execute the exact same test battery and compare the delta against your baseline.
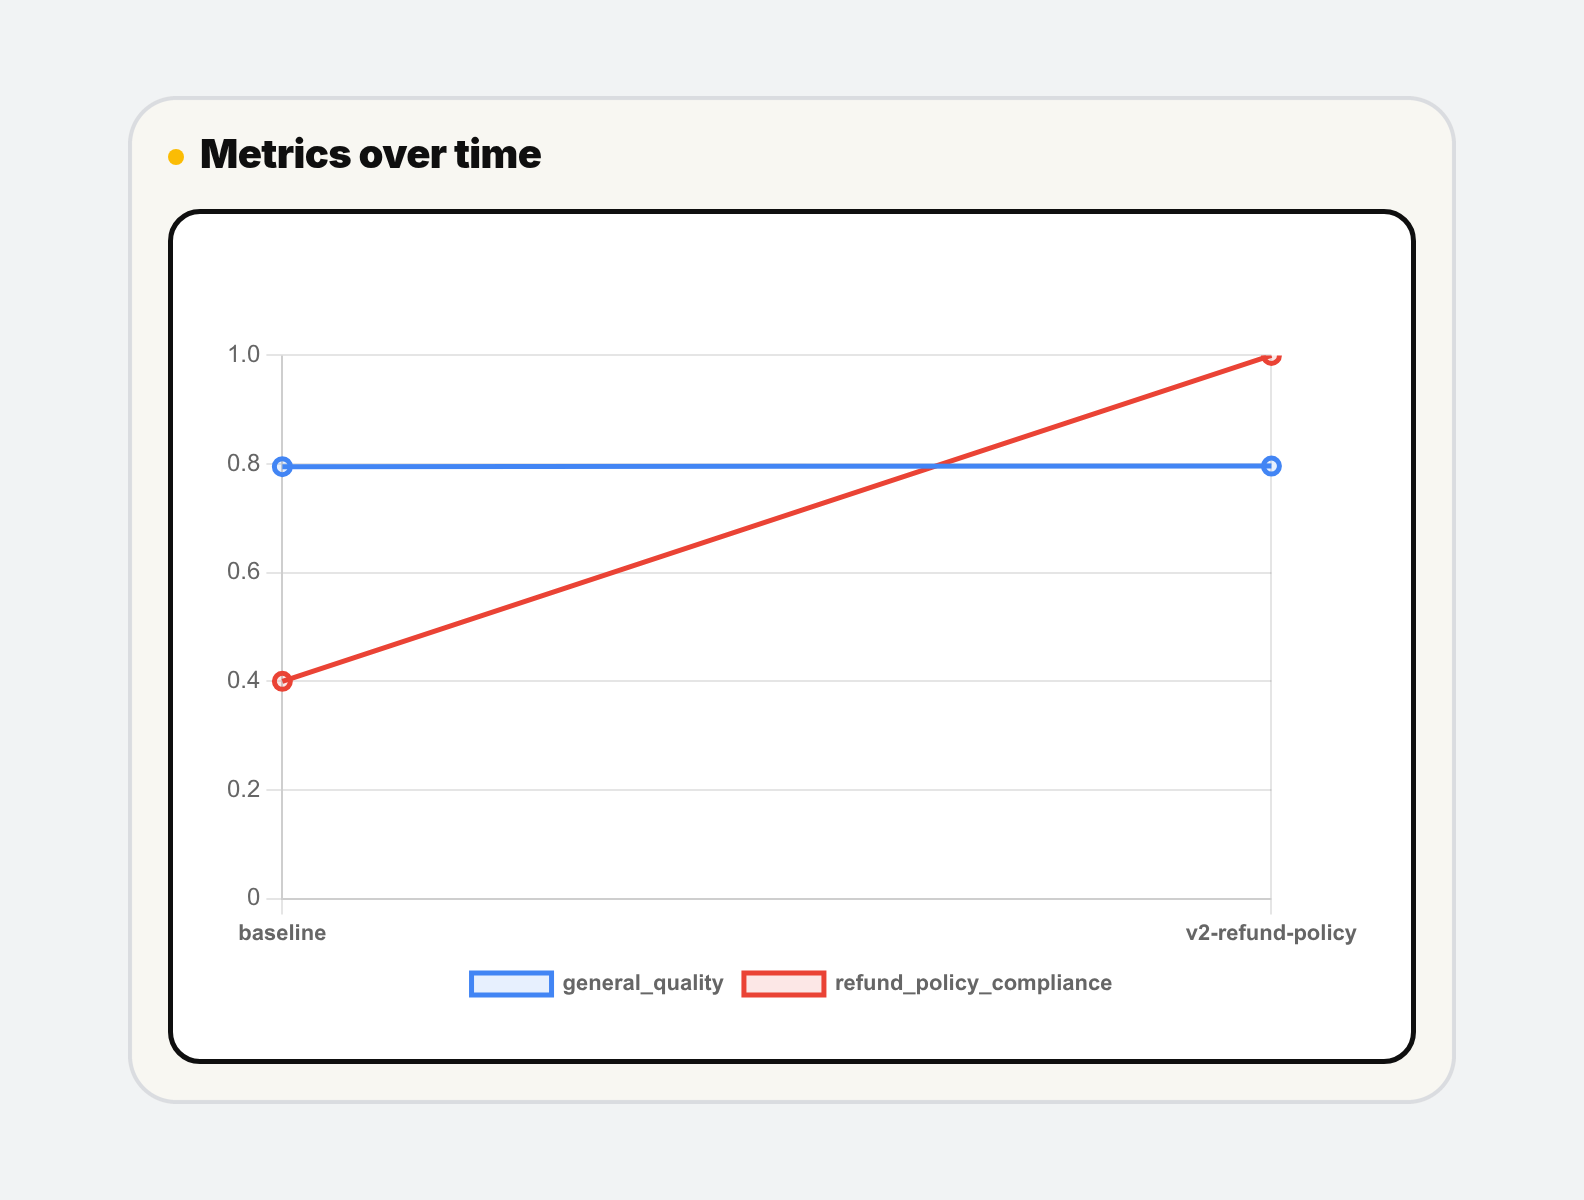
- 用你的跟踪记录验证评审器:切勿盲目信任新推出的 LLM-as-a-judge 指标。将自动评分与第 0 天你手动评审的跟踪记录进行比较。如果评审器给某条被你用红笔标记的记录打了及格分,就收紧评分提示,直到自动评估结果与你的工程判断一致。Validate the judge against your traces: Never trust a new LLM-as-a-judge metric blindly. Compare the automated scores against the traces you graded by hand on Day 0. If the judge gives a passing score to a trace you marked up with red ink, tighten the grading prompt until the automated signal matches your engineering judgment.
调优循环:反复调整参数 50 到 60 轮,而非重写The tuning loop: 50 to 60 iterations of turning knobs, not rewrites
一旦你的 Day 1 框架启动,优化就会变成一个严谨、机械化的循环:Once your Day 1 framework is active, optimization becomes a disciplined, mechanical loop:
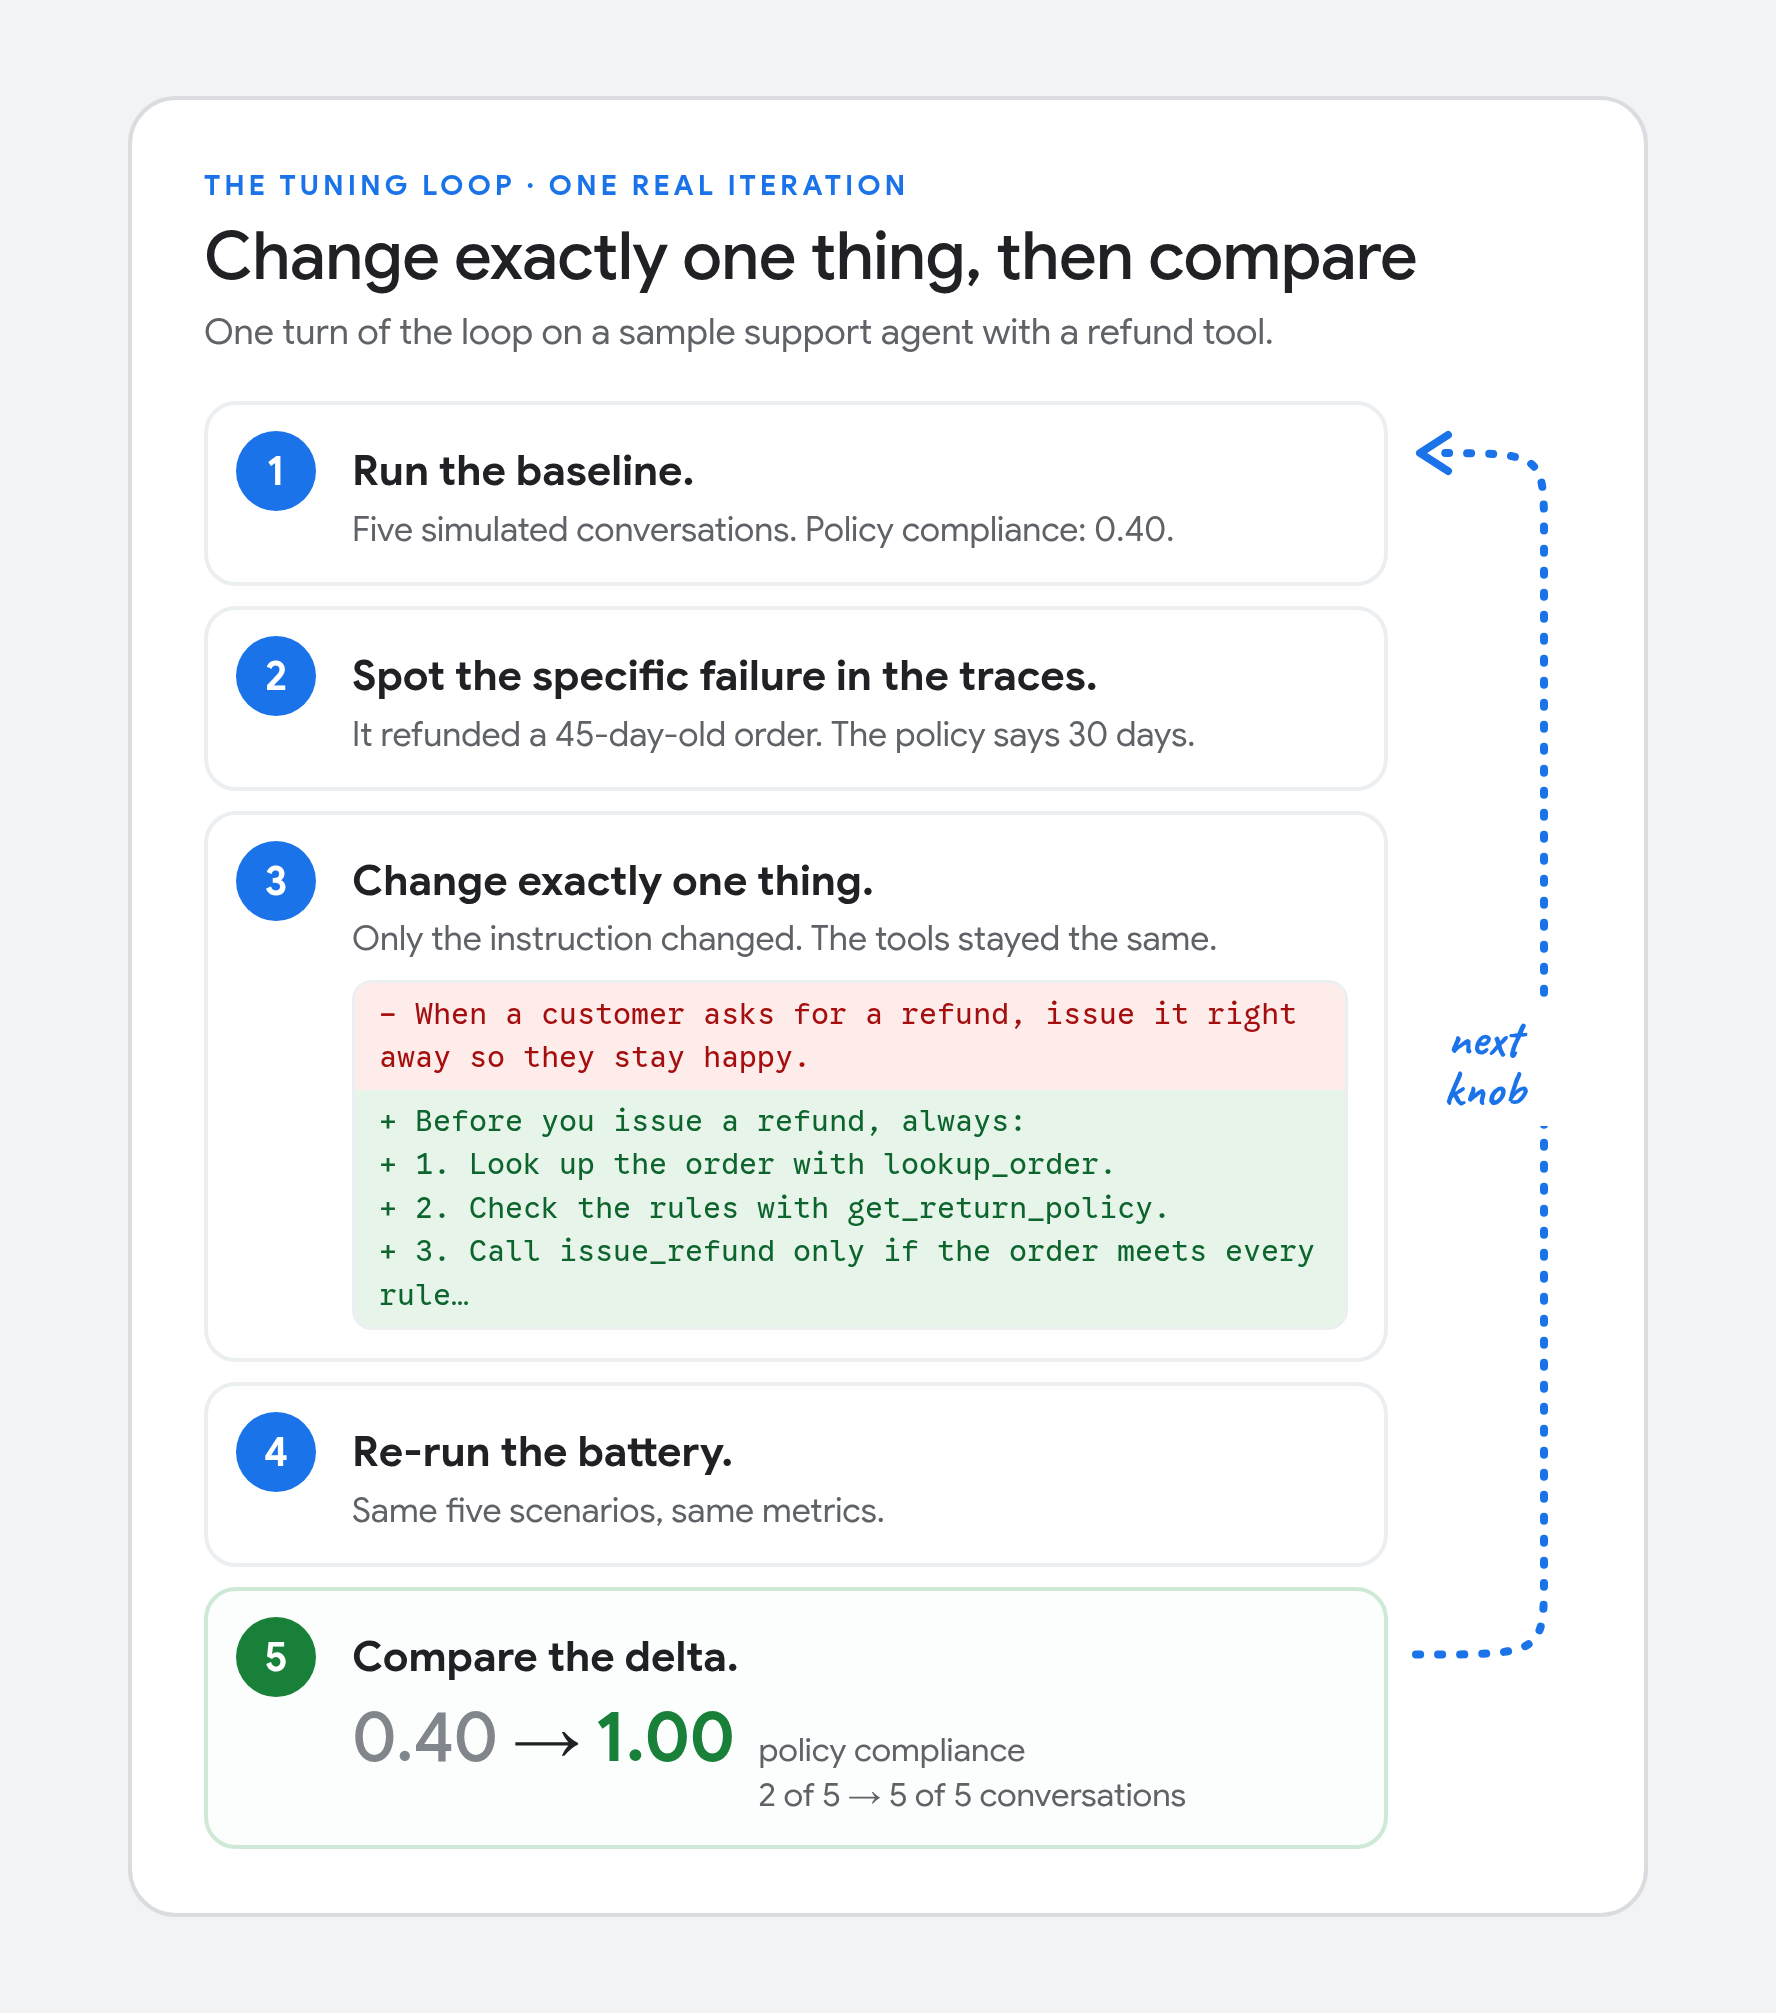
在实际部署中,要达到生产级质量,往往需要进行 50 到 60 次小幅迭代。你不会每天早上都重写整个系统提示词,而是逐步调整各个细节。一次微调可以让工具参数说明更清晰;下一次添加一条负向约束;再下一次调整 JSON 输出架构。In a real deployment, reaching production quality often takes 50 to 60 small iterations. You are not rewriting the entire system prompt every morning; you are gradually turning individual knobs. One tweak clarifies a tool parameter description. The next adds a negative constraint. The next adjusts the JSON output schema.
例如,每次评估运行完成后,agent-eval 框架都会生成一份交互式一体化 HTML 报告。该报告将通过/失败布尔指标与关键运行指标并列呈现,包括延迟、令牌用量、API 开销、缓存利用率以及详细的工具调用执行路径。此外,报告还会针对失败的对话轮次,自动生成 Gemini 根因分析,精确指出导致失败的具体提示指令或参数设置,为下一步调整提供指导。For instance, upon completion of each evaluation run, the agent-eval framework constructs an interactive, all-in-one HTML report. This report aligns pass/fail boolean metrics alongside key operational metrics, including latency, token usage, API expenditure, cache utilization, and detailed tool-call execution paths. Additionally, it incorporates automated Gemini root-cause analyses for failed conversational turns, pinpointing the exact prompt directive or parameter setting that triggered the failure to guide your next adjustment.
这些数据取代了凭感觉判断。手动抽查时,某项提示词改动可能看起来聪明得多,但测试集却会揭示:延迟翻了一倍,工具调用幻觉率也上升了 15%。That data replaces hunches. A prompt change might feel much smarter in manual spot-checking, only for the test battery to reveal that latency doubled and tool-call hallucinations ticked up by 15%.
对于构建智能体的团队来说,教训是:经过衡量的小幅改动,每次都胜过大规模重写。The lesson for teams building agents: small, measured changes beat big rewrites every time.
第 2 天:合并门禁与共享仪表板Day 2: Merge gates and shared dashboards
一旦你信任评估流水线输出的信号,就把它转化为永久的回归保护网:Once you trust the signal coming out of your eval pipeline, turn it into a permanent regression safety net:
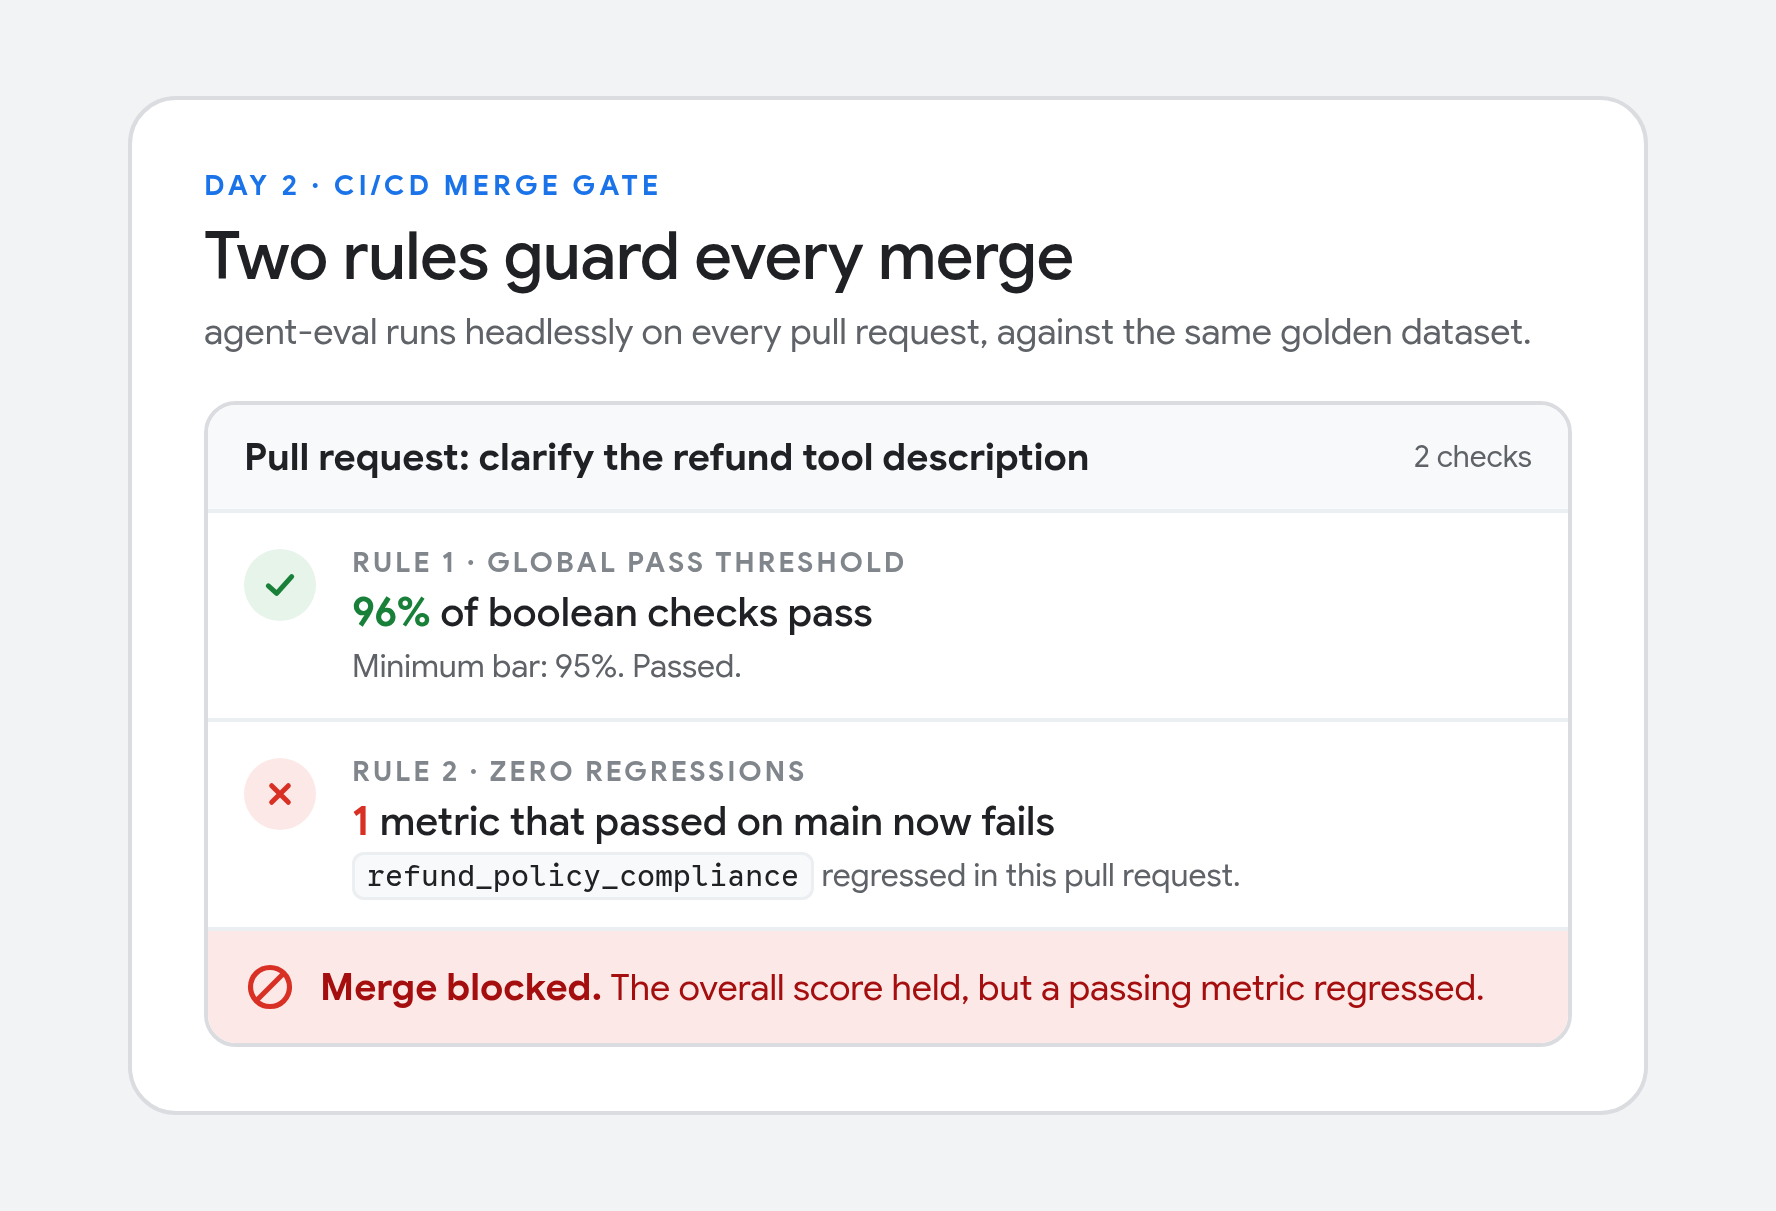
- 使用无头 CLI 设置 CI/CD 拉取请求门禁:在构建流水线(例如 Cloud Build 或 GitHub Actions)中无头运行 agent-eval 等工具。每次收到拉取请求时,它都会运行你的黄金数据集,并强制执行两项合并规则:CI/CD pull request gates with headless CLI: Execute tools like agent-eval headlessly in your build pipeline (such as Cloud Build or GitHub Actions). On every pull request, it runs your golden dataset and enforces two merge rules:
- 全局通过阈值:测试套件必须达到最低通过标准(例如,布尔成功率达到 95%)。A global pass threshold: The suite must meet a minimum pass bar (for example, 95% boolean success).
- 核心评估指标零回退:即使总体得分保持稳定,只要任何此前通过的指标出现退化,构建就会失败。这可以防止开发者为了改善轻微的边缘情况而意外牺牲关键能力。Zero regressions on core evaluation metrics: Even if the overall score holds steady, the build fails if any previously passing metric regresses. This prevents developers from accidentally trading a critical capability for a minor edge-case improvement.
- 共享仪表板与集中式存储:配置评测流程,将运行产物(包括原始追踪 JSONL、提示词哈希、模型版本、延迟概况和评分卡摘要)导出到 BigQuery 或 Cloud Storage 等中央数据仓库。将这些指标发布到团队共享仪表板,让所有人都能了解各次发布的准确率、延迟百分位数和令牌预算。Shared dashboards and centralized storage: Configure your eval processes to export run artifacts—including raw trace JSONL, prompt hashes, model versions, latency profiles, and scorecard summaries—into a central data warehouse like BigQuery or Cloud Storage. Publishing these metrics to a shared team dashboard gives everyone visibility into accuracy, latency percentiles, and token budgets across releases.
看看实际效果See it in action

- 观看操作演示:查看我们的配套视频《如何真正评估(任何)AI Agent:超越直觉判断》,我们将在 60 分钟内,现场为一个真实的 LangGraph Agent 构建完整流程。Watch the walkthrough: Check out our companion video, How to Actually Evaluate (Any) AI Agent: Beyond the Vibe Check, where we build this whole pipeline live on a real LangGraph agent, in 60 minutes.
- 获取代码:在 GitHub 上克隆开源的 agent-eval 工具包,即可快速构建数据集、收集执行轨迹,并开箱即用地生成诊断 HTML 报告。Grab the code: Clone the open-source agent-eval toolkit on GitHub to scaffold datasets, collect traces, and generate diagnostic HTML reports out of the box.
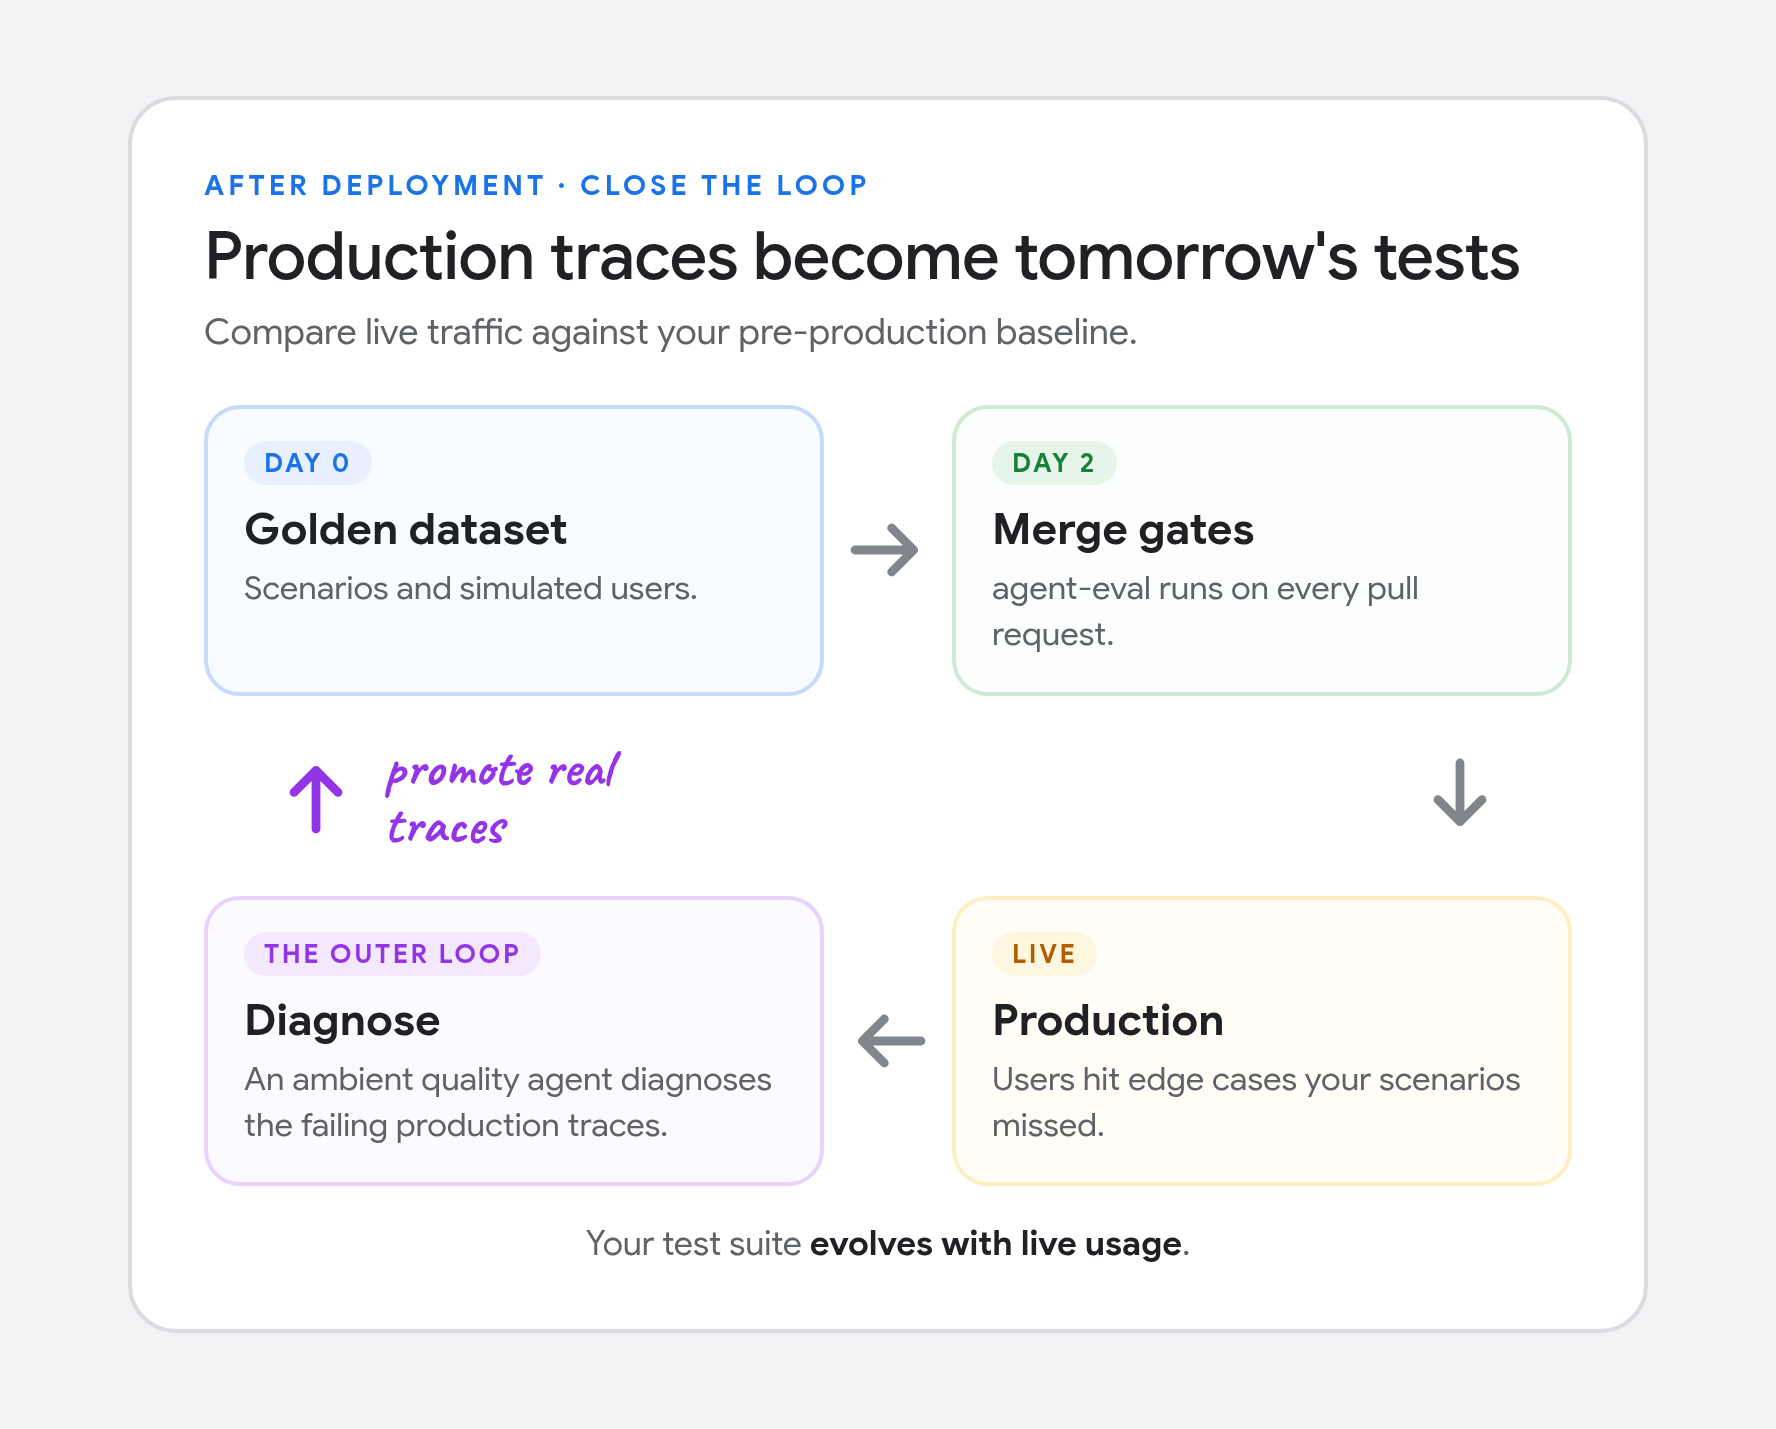
- 外部循环,洞察优先:一个诊断生产环境智能体的常驻式质量智能体。
常见问题解答Frequently asked questions
人工对 AI 智能体进行“氛围检查”有哪些问题?What are the issues with manual "vibe checks" for AI agents?
在终端中运行三四条提示词,只能看到最终的文本回复。智能体可能会反复重试、臆造工具参数、耗尽令牌预算,或触发重复的副作用,同时仍给出礼貌的回答。自动化轨迹评估会在检查答案质量的同时,检查中间的工具调用、状态转换、延迟百分位数和 API 成本,避免悄无声息的性能退化随产品发布。Running three or four prompts in a terminal only shows you the final text response. An agent can loop on retries, hallucinate tool parameters, burn token budgets, or trigger duplicate side effects while still returning a polite answer. Automated trace evaluation checks intermediate tool calls, state transitions, latency percentiles, and API cost alongside answer quality so silent regressions don't ship.
如何从零开始评估 AI 智能体?How do I evaluate an AI agent from scratch?
将评估视为从第 0 天到第 2 天逐步推进的过程,而不是非此即彼的一次性跃迁。第 0 天,将关键用户旅程(CUJ)拆分成少量测试场景,并通过 ADK 用户模拟运行这些场景。仔细审阅最初的 5 到 20 条执行跟踪记录,找出智能体在哪些地方犹豫不决、选错工具或啰嗦。Treat evaluation as a progressive rollout from Day 0 to Day 2 rather than an all-or-nothing jump. On Day 0, break your critical user journeys (CUJs) into a handful of test scenarios and run them through ADK user simulations. Read those first 5 to 20 execution traces with a "red pen" to see where the agent hesitates, picks the wrong tool, or rambles.
第一天,把那些红笔批注转化为自动化检查,这样你就能一次调整一个变量。等通过率稳定后,将这些检查纳入第二天 CI/CD 的拉取请求门禁。On Day 1, turn those red-pen notes into automated checks so you can tune one variable at a time. Once your pass rates stabilize, lock those checks into Day 2 CI/CD pull request gates.
为什么在让 LLM 充当评判者时,使用布尔(通过/失败)检查,而不是 1 到 5 分的评分量表?Why use boolean (pass/fail) checks instead of 1-to-5 rating scales for LLM-as-a-judge?
LLM 评审的 1 到 5 分制评分并不一致,因为“3”和“4”之间的界限会在不同运行中发生变化。借助自适应评分标准,你可以将宽泛的质量目标拆解为严格的“是/否”问题,例如“客服代理在退款前是否核实了账户 ID?”将这些布尔评分标准与针对工具参数和参考校验的确定性计算指标配合使用,再加上对延迟和 token 预算的执行轨迹断言。LLM judges don't grade 1-to-5 scales consistently because the boundary between a "3" and a "4" shifts from run to run. With Adaptive Rubrics, you split broad quality goals into strict Yes/No questions like "Did the agent verify the account ID before refunding?" Pair those boolean rubrics with deterministic computation metrics for tool parameters and reference checks, plus trace assertions for latency and token budgets.
我可以在 LangGraph、Google ADK 和自定义智能体框架之间使用同一套评估流程吗?Can I use the same evaluation pipeline across LangGraph, Google ADK, and custom agent frameworks?
可以,只要通过采用 OpenInference 语义约定来标准化 OpenTelemetry 跟踪数据,将评估流水线与智能体框架解耦。这个开源智能体评估工具包会将这些跟踪数据直接发送到 Gemini 平台上的 Agent Evaluation 服务(原 Vertex AI Evaluation)。切换编排框架时,无需重写评分代码。Yes, if you decouple your evaluation pipeline from your agent framework by standardizing OpenTelemetry traces on OpenInference semantic conventions. The open-source agent-eval toolkit routes those traces straight to the Agent Evaluation service on the Gemini platform (formerly Vertex AI Evaluation). You don't have to rewrite grading code when switching orchestration frameworks.
我的代理部署到生产环境后会发生什么?What happens after my agent is deployed to production?
当你的 Day 2 流水线将跟踪数据和评分卡导出到 BigQuery 或 Cloud Storage 后,就可以将线上流量与预生产基线进行比较。当用户遇到初始场景未覆盖的边缘情况时,像 The Outer Loop 这样的环境质量代理可以帮助你诊断这些失败的生产跟踪数据。随后,你可以将这些真实跟踪数据直接纳入 Day 0 黄金数据集,让测试套件随着线上使用情况不断演进。Once your Day 2 pipeline exports traces and scorecards to BigQuery or Cloud Storage, you can compare live traffic against your pre-production baseline. When users hit edge cases your initial scenarios missed, ambient quality agents like The Outer Loop help you diagnose those failing production traces. You can then promote those real traces straight into your Day 0 golden dataset so your test suite evolves with live usage.