
借助 Model Explorer 为自定义边缘编译器带来可视化图调试
原题Bringing Visual Graph Debugging to Custom Edge Compilers with Model Explorer
推荐理由边缘编译器工程师可学习把中间表示和性能信息连起来,缩短导出回归、设备委派和周期瓶颈的定位路径。
读前速览
Google AI Edge Model Explorer 支持对自定义边缘编译器 IR 进行可视化调试,帮助 Arm 工程师发现导出回归、验证 NPU 委派,并精准定位边缘设备上的周期级瓶颈。
Model Explorer 的插件架构支持为边缘部署可视化自定义编译器 IR。
Arm 为 TOSA、VGF 和 PTE 格式构建了开源适配器,让工程师无需解析原始 flatbuffers 或日志,就能检查层级图结构、算子属性和张量连接。
通过并排对比 CPU 与 NPU 计算图,分屏视图可验证硬件委派情况。
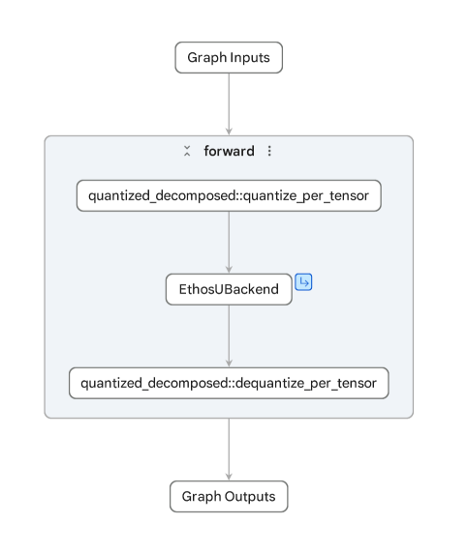
在 Ethos-U85 上运行 YOLO 模型时,视图清晰显示 NPU 计算图将多个层折叠为一个位于量化与反量化节点之间的 EthosUBackend 模块,而 CPU 计算图则逐层展示网络,因此能立即发现部分委派和回退子图。
逐节点轨迹叠加可将周期级剖析数据直接映射到执行图上。
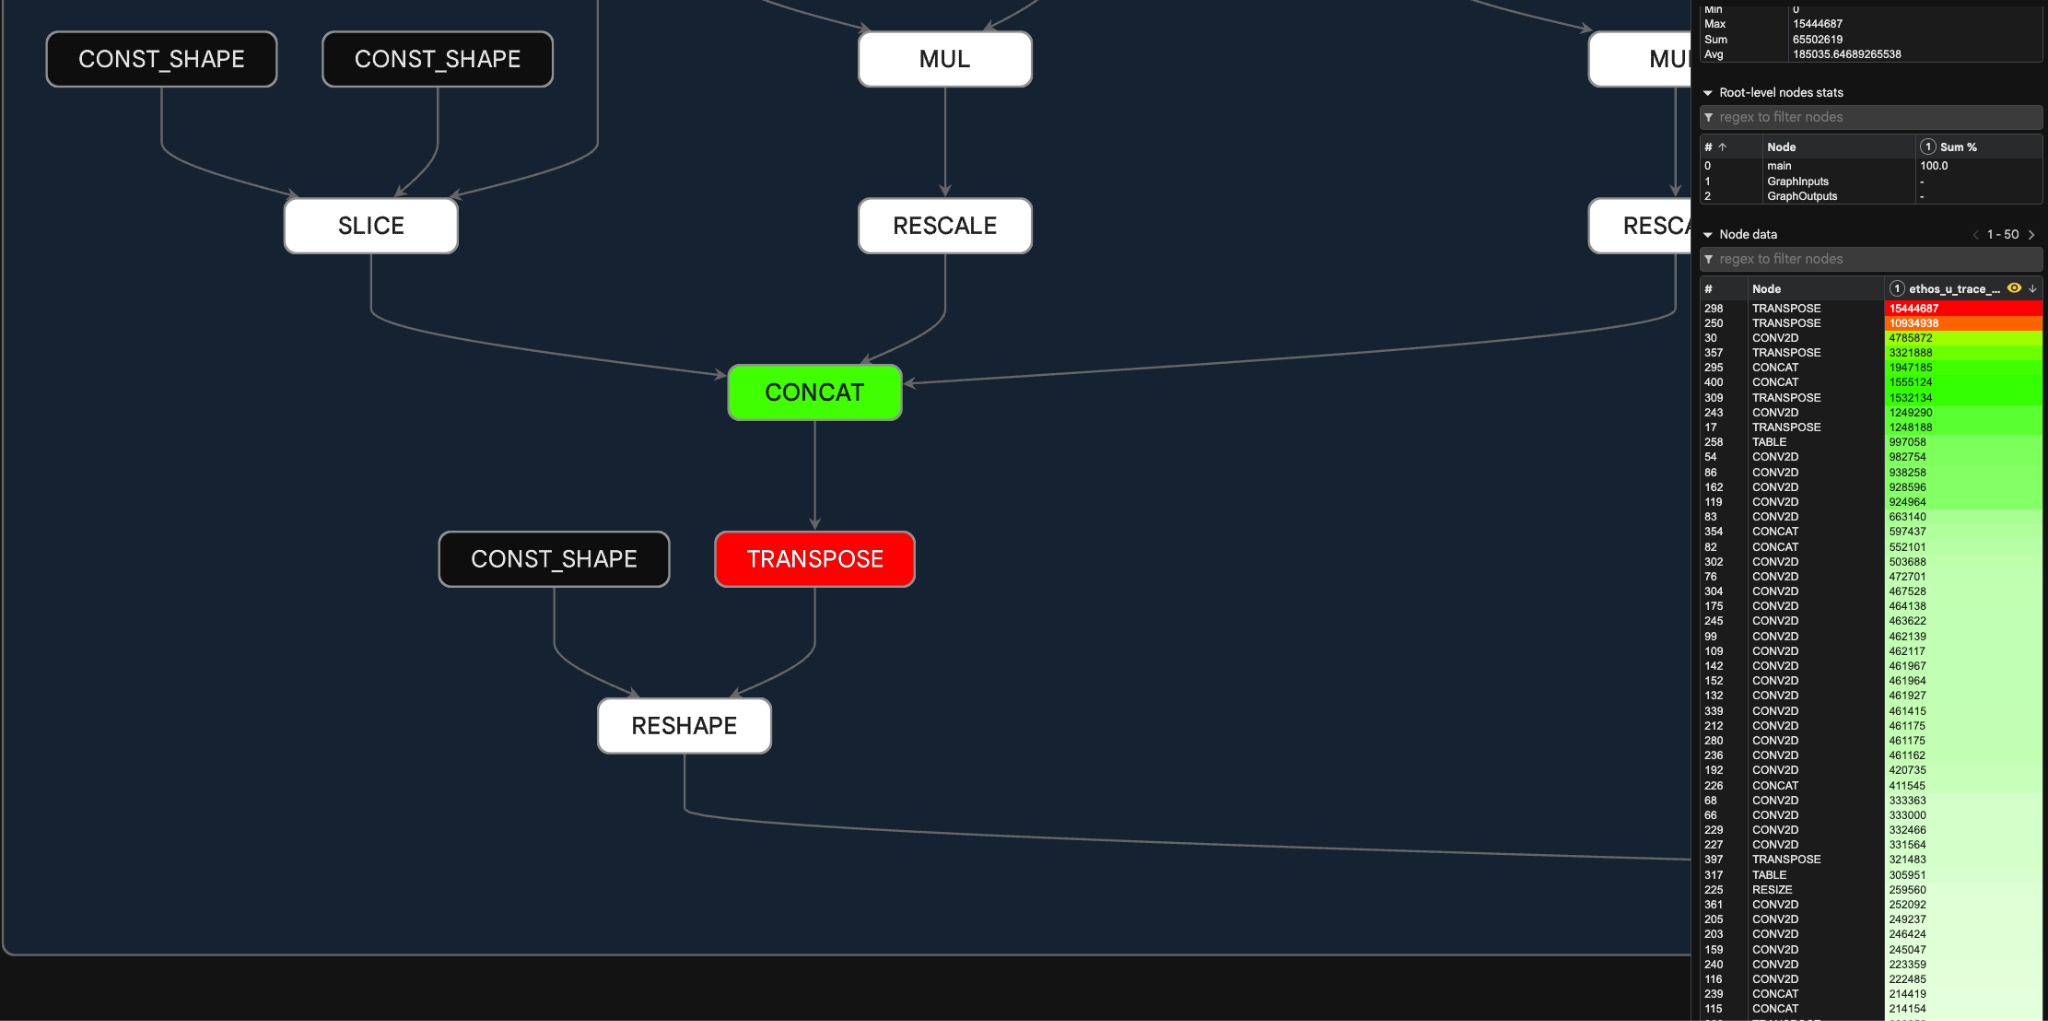
在 Arm Fixed Virtual Platform 模拟器上运行模型可生成周期精确的轨迹;Model Explorer 的节点数据插件会将其渲染为颜色编码热力图。在示例中,这帮助定位到一个 TRANSPOSE 算子,它是主要延迟瓶颈。
完整摘要
本文展示了 Arm 如何利用 Google AI Edge Model Explorer 的插件架构,为 TOSA、VGF 和 PTE 模型格式构建开源适配器。文章介绍了 3 种实际工作流:检测通过 ExecuTorch 导出的 Neural Super Sampling 模型中意外出现的 TRANSPOSE 算子;使用分屏视图对比 Ethos-U85 上 YOLO 模型的 CPU 与 NPU 委派计算图,以确认委派是否完整;将 Arm Fixed Virtual Platform 模拟器生成的周期精确剖析轨迹叠加到执行图上,从而发现 TRANSPOSE 节点是主要延迟瓶颈。文章还提供了安装步骤,以及所有适配器的 GitHub 链接。
目录 · 7 节
Model Explorer 不止于高层模型图。了解 Arm 如何接入自定义编译器 IR、并排验证 NPU 委派执行,并将周期级性能分析轨迹直接映射到执行图上。Model Explorer goes beyond high-level model graphs. See how Arm plugs in custom compiler IRs, verifies NPU delegation side-by-side, and maps cycle-level profiling traces directly onto your execution graph.
机器学习模型可在各种硬件上本地运行,涵盖低功耗边缘设备、游戏显卡和物理 AI 系统。要在这些设备上高效运行模型,需要进行量化、图降低、算子融合和硬件委托等编译步骤。Machine learning models run locally on a wide range of hardware, from low-power edge devices to gaming graphics and physical AI systems. Running models efficiently on these targets requires compilation steps such as quantization, graph lowering, operator fusion, and hardware delegation.
Arm 使用 Google AI Edge Model Explorer,让开发者能够了解这些流水线的运行情况。借助 Model Explorer 的分层图可视化功能和插件架构,Arm 构建了多个开源适配器,使边缘模型转换过程更易于检查。Arm used Google AI Edge Model Explorer to give developers visibility into these pipelines. With Model Explorer's hierarchical graph visualization and plugin architecture, Arm built several open-source adapters that make edge model transformations easier to inspect.
挑战The Challenge
将模型部署到边缘硬件时,框架变更或算子限制可能会改变导出的执行图。工程师通常需要回答三个问题:When deploying a model to edge hardware, a framework change or operator constraint can alter the exported execution graph. Engineers often need to answer three questions:
- 结构完整性:图降级是否引入了非预期的算子,例如额外的布局转置?Structural integrity: Did graph lowering introduce unintended operators such as extra layout transposes?
- 硬件委派:模型是否完全委派给 NPU 或 GPU,还是不受支持的子图回退到了 CPU?Hardware delegation: Is the model fully delegated to the NPU or GPU, or are unsupported subgraphs falling back to the CPU?
- 周期级瓶颈:降低后的图中哪些节点占用的计算周期最多?Cycle-level bottlenecks: Which nodes in the lowered graph take the most compute cycles?
通过读取原始 FlatBuffers 或文本日志来回答这些问题需要花费时间,尤其是在处理大型语言模型(LLM)和神经网络时。Arm 需要一种可视化工具,用于检查 Arm 专用的中间表示和硬件性能分析跟踪数据。Answering these questions by reading raw flatbuffers or text logs takes time, especially for large language models (LLMs) and neural networks. Arm needed a visual tool to inspect Arm-specific intermediate representations and hardware profiling traces.
Arm 如何使用 Model Explorer 的可视化调试工作流How Arm Used Model Explorer's Visual Debugging Workflows
为应对这些部署挑战,Arm 为 Google AI Edge Model Explorer 开发了自定义适配器,以支持多种模型格式(即 TOSA、VGF 和 PTE),从而建立起一套全面的可视化端侧优化工作流。借助这些扩展,工程团队可以验证导出的流水线、确认加速器委派情况,并直接在模型图上精准定位周期级性能瓶颈:To address these deployment challenges, Arm developed custom adapters for Google AI Edge Model Explorer to support several model formats (i.e., TOSA, VGF, and PTE), establishing a comprehensive visual workflow for on-device optimization. Using these extensions, engineering teams can validate exported pipelines, verify accelerator delegation, and pinpoint cycle-level performance bottlenecks directly on the model graph:
1. 发现 VGF 中隐藏的导出回归问题1. Catching hidden export regressions in VGF
Arm 工程师使用 Model Explorer 验证了一个由 PyTorch 训练、通过 ExecuTorch Arm 后端导出为 VGF 文件(用于 Vulkan ML Extensions)的神经超采样(NSS)模型。在检查 VGF 图时,团队发现 ExecuTorch Arm 后端的一项变更引入了非预期的 TRANSPOSE 运算符。Arm engineers used Model Explorer to validate a PyTorch-trained Neural Super Sampling (NSS) model exported through the ExecuTorch Arm backend as a VGF file for Vulkan ML Extensions. While inspecting the VGF graph, the team found unintended TRANSPOSE operators introduced by a change in the ExecuTorch Arm backend.
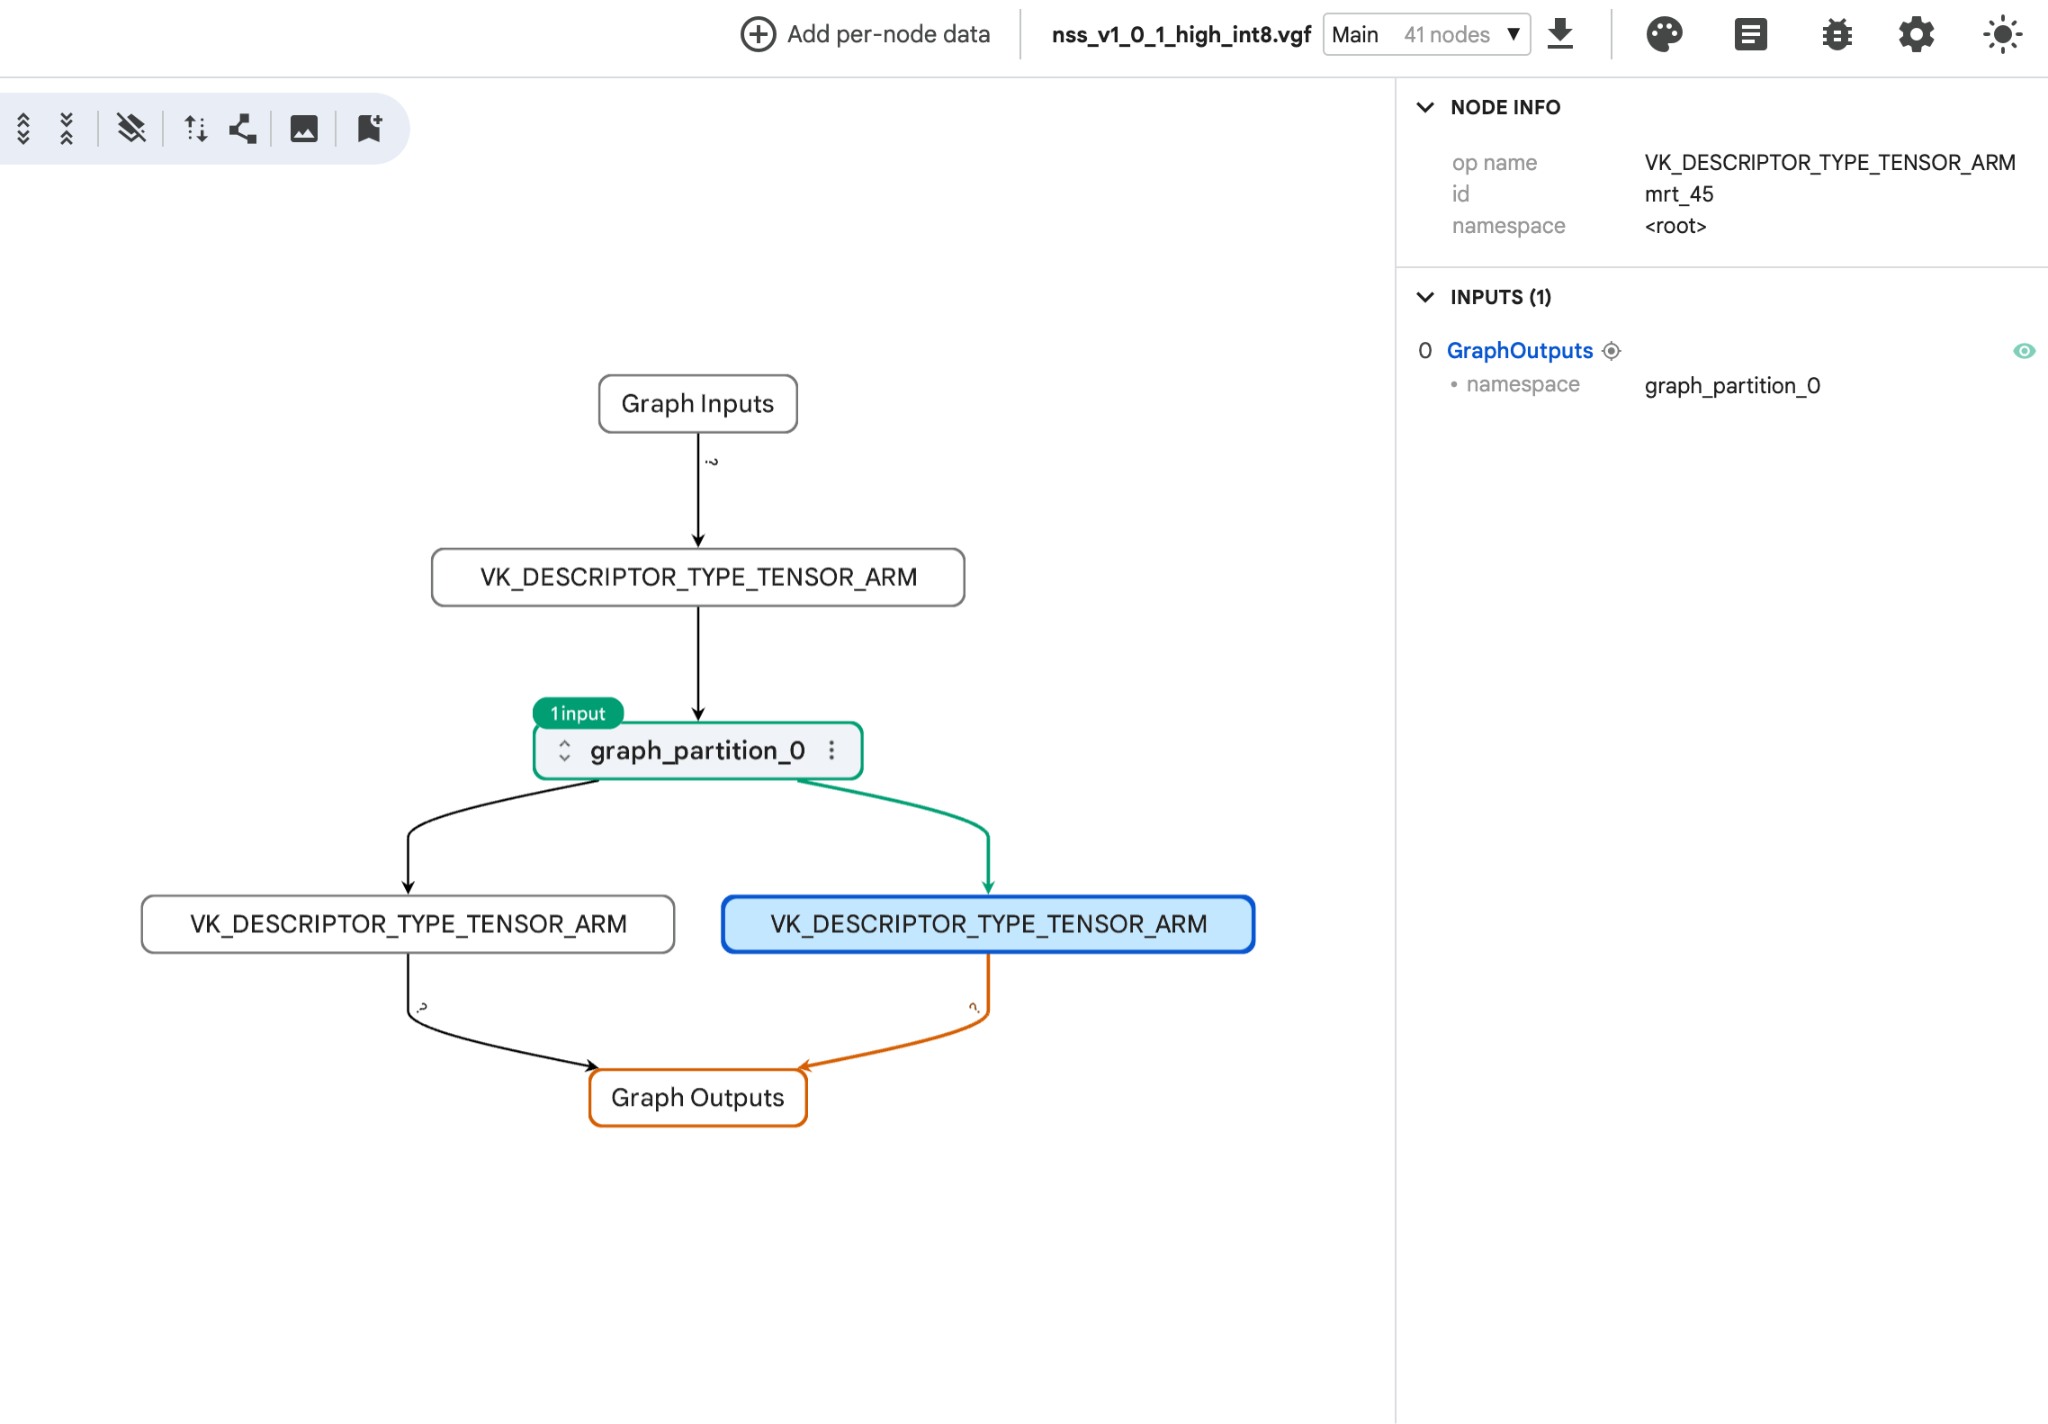
Model Explorer 可让用户检查模型图中的各个节点,例如下图所示的重缩放算子,并显示该算子的属性及 SPIR-V 张量连接。这项功能帮助 Arm 团队识别并解决了此次回归问题,无需手动分析原始日志文件。Model Explorer enables users to inspect individual nodes of the model graph, such as the rescale operator depicted below, which displays the operator's attributes and SPIR-V tensor connections. This functionality assisted the Arm team in identifying and resolving the regression without requiring manual analysis of raw log files.
2. 使用分屏视图验证 NPU 委派与 CPU 回退2. Verifying NPU delegation vs. CPU fallback with Split-Pane View
为了针对 Arm Ethos-U85 NPU 等加速器优化视觉模型,Arm 工程师使用 Model Explorer 的分屏视图,并排比较了 Ultralytics YOLO 模型在 CPU 上运行的计算图与委托给 NPU 的计算图。To optimize vision models for accelerators like the Arm Ethos-U85 NPU, Arm engineers used Model Explorer's split-pane view to compare CPU and NPU-delegated graphs side-by-side for a Ultralytics YOLO model.
分屏视图展示了结构上的差异:CPU 图会显示每个独立层,而 NPU 图则将网络归并为一个位于量化节点和反量化节点之间的 EthosUBackend 块。对于在 LiteRT 或 ExecuTorch 中仅获得部分支持的模型,此视图有助于识别未委托的算子和拆分后的子图。The split-pane view showed the structural difference: the CPU graph displays each individual layer, while the NPU graph groups the network into a single EthosUBackend block between quantize and dequantize nodes. For partially supported models in LiteRT or ExecuTorch, this view helps identify un-delegated operators and split subgraphs.
3. 使用逐节点跟踪叠加精准定位硬件瓶颈3. Pinpointing Hardware Bottlenecks with Per-node Trace Overlays
为了找出 Ethos-U NPU 上的延迟瓶颈,Arm 在其 Fixed Virtual Platform (FVP) 模拟器上运行模型,并使用 Model Explorer 的节点数据插件,将周期精确的执行跟踪叠加到计算图上。颜色编码的热力图显示,单个 TRANSPOSE 节点是主要的延迟瓶颈。To find latency bottlenecks on the Ethos-U NPU, Arm ran their model on their Fixed Virtual Platform (FVP) simulator and used Model Explorer's node data plugin to overlay cycle-accurate execution traces onto the graph. Color-coded heatmaps showed that a single TRANSPOSE node was the main latency bottleneck.
如何开始使用How to get started
今天,你可以通过 PyPI 或 GitHub 使用 Google AI Edge Model Explorer 和 Arm 的开源适配器,在本地检查并优化自己的端侧模型。You can use Google AI Edge Model Explorer along with Arm's open-source adapters today to inspect and optimize your own on-device models locally via PyPI or GitHub.
- Install Google AI Edge Model Explorer
- Install adapter and launch Model Explorer for your model format.
- LiteRT adapter (built-in)
- PyTorch adapter (built-in)
- Hugging Face Transformers adapter (built-in)
- TOSA adapter (Arm plugin)
- VGF adapter (Arm plugin)
- PTE adapter (Arm plugin)
- See User Guide and try out major features:
致谢Acknowledgements
特别感谢 Arm 和 Google AI Edge 团队的各位贡献者为这些适配器和集成所做的工作:Special thanks to the contributors across the Arm and Google AI Edge teams for their work on these adapters and integrations:
工程师:Engineers:
- ARM:纳鲁蒙·普朗纳瓦拉特、约书亚·斯莱特、斯特凡娜·西米翁、亚当·霍德森、阿洛娜·恩莱特-穆尼、阿龙·维尔吉纳什-塔尔、凯里·威廉姆斯、格列布·维尼琴科、哈姆扎·阿尔斯兰、马尔科·多明戈、马修·斯洛扬、迈克尔·麦克·柯廷、米奇·贝利、理查德·伯顿、罗伯特·休斯、罗伯特·泰勒、托马斯·阿古斯丁·冈萨雷斯·奥兰多ARM: Narumol Prangnawarat, Joshua Slater, Stefana Simion, Adam Hodson, Alona Enraght-Moony, Áron Virginás-Tar, Carey Williams, Gleb Vinnychenko, Hamza Arslan, Marco Domingo, Matthew Sloyan, Michael Mc Curtin, Mitch Bailey, Richard Burton, Robert Hughes, Robert Taylor, Tomás Agustín González Orlando
- Google: Alan Ma, Eric Yang, Jing Jin, Na Li
Product manager: Charlie Stokes (ARM), Derek Bekebrede
Designers: Ami Kubota, Ioannis Politis (ARM), Kathleen Low, Philip Watson (ARM)
Senior Sponsors: Bala Gattu (ARM), Cormac Brick, Joe Alderson (ARM), Matthias Grundmann, Sharbani Roy (ARM)